Big Ideas Math Algebra 2 Answers Chapter 10 Probability is provided by subject experts adhering to the latest common core curriculum guidelines. Want to be Proficient in the Concepts of BIM Algebra 2 Ch 10 Probability? Then, start practicing constantly from our BigIdeas Math Book High School Algebra 2 Lesson 10 Probability Answer Key. Here, you can get the solutions in a detailed way for easy and better understanding to students so download the Ch 10 lesson-wise Big Ideas Math Algebra 2 Textbook Answers on Probability for free of charge & ace up your preparation.
Big Ideas Math Book Algebra 2 Answer Key Chapter 10 Probability
High School Candidates are recommended to access the below provided Topicwise Big Ideas Math Algebra 2 Ch 10 Probability Solutions and clear their doubts within no time. You can see step-by-step explained solutions in a simple and easy-to-understand language which are designed by the subject experts as per the latest common core 2019 curriculum. All you need to do is hit on the direct links available below and download the Big Ideas Math Textbook Solution Key for preparing the Algebra 2 Ch 10 Probability concepts efficiently in a free time.
- Probability Maintaining Mathematical Proficiency – Page 535
- Probability Mathematical Practices – Page 536
- Lesson 10.1 Sample Spaces and Probability – Page(537-544)
- Sample Spaces and Probability 10.1 Exercises – Page(542-544)
- Lesson 10.2 Independent and Dependent Events – Page(545-552)
- Independent and Dependent Events 10.2 Exercises – Page(550-552)
- Lesson 10.3 Two-Way Tables and Probability – Page(553-560)
- Two-Way Tables and Probability 10.3 Exercises – Page(558-560)
- Probability Study Skills: Making a Mental Cheat Sheet – Page 561
- Probability 10.1–10.3 Quiz – Page 562
- Lesson 10.4 Probability of Disjoint and Overlapping Events – Page(563-568)
- Probability of Disjoint and Overlapping Events 10.4 Exercises – Page(567-568)
- Lesson 10.5 Permutations and Combinations – Page(569-578)
- Permutations and Combinations 10.5 Exercises – Page(575-578)
- Lesson 10.6 Binomial Distributions – Page(579-584)
- Binomial Distributions 10.6 Exercises – Page(583-584)
- Probability Performance Task: A New Dartboard – Page 585
- Probability Chapter Review – Page(586-588)
- Probability Chapter Test – Page 589
- Probability Cumulative Assessment – Page(590-591)
Probability Maintaining Mathematical Proficiency
Write and solve a proportion to answer the question.
Question 1.
What percent of 30 is 6?
Answer:
Given that
6 is what percent of 30 =20%
Explanation: Step 1:We make the assumption that 30 is 100%since it is our output value
Step 2: We next represent the value we seek with X.
step 3 :From step 1, it follows that 100%=30
Step 4: In the same vein , x%=6
Step 5 : This gives us a pair of simple equations:
100%=30(1)
x%=6(2)
Step 6 :By simple dividing equation 1 by equation 2 and taking note of the fact
that both the LHS of both equation have the same unit (%); we have
100%/x%=30/6
Step 7 : Taking the inverse of both sides yields
100%/x%=6/30
x=20%
Question 2.
What number is 68% of 25?
Answer:
Given that 68% of 25=17
Explanation:(68:100)*25
(68*25):100
=1700:100=17
Question 3.
34.4 is what percent of 86?
Answer:
34.4:86*100
(34.4*100):86
3440:86 = 40
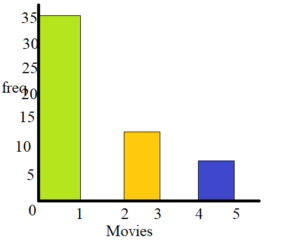
Display the data in a histogram.
Question 4.

Answer:
Question 5.
ABSTRACT REASONING
You want to purchase either a sofa or an arm chair at a furniture store. Each item has the same retail price. The sofa is 20% off. The arm chair is 10% off, and you have a coupon to get an additional 10% off the discounted price of the chair. Are the items equally priced after the discounts are applied? Explain.
Answer:
Given,
You want to purchase either a sofa or an arm chair at a furniture store. Each item has the same retail price. The sofa is 20% off. The arm chair is 10% off, and you have a coupon to get an additional 10% off the discounted price of the chair.
0.9x – 10(0.9/100x)
0.9x – 0.09x = 0.81x
Now the price of the sofa after the 20% discount is 0.8x but the price of armchair after 10% discount and additional 10% discount on using the coupon is 0.81x, which is greater than the price of the sofa.
Thus the items are not equally priced after the discounts are applied.
Probability Mathematical Practices
Mathematically proficient students apply the mathematics they know to solve real-life problems.
Monitoring Progress
In Exercises 1 and 2, describe the event as unlikely, equally likely to happen or not happen, or likely. Explain your reasoning.
Question 1.
The oldest child in a family is a girl.
Answer: equally likely to happen
Question 2.
The two oldest children in a family with three children are girls.
Answer: Unlikely
Question 3.
Give an example of an event that is certain to occur.
Answer: An event that is certain to happen has a probability of 1. … Examples of Events: tossing a coin and it landing on heads. tossing a coin and it landing on tails.
Lesson 10.1 Sample Spaces and Probability
Essential Question How can you list the possible outcomes in the sample space of an experiment?
The sample space of an experiment is the set of all possible outcomes for that experiment.
EXPLORATION 1
Finding the Sample Space of an Experiment
Work with a partner. In an experiment, three coins are flipped. List the possible outcomes in the sample space of the experiment.

Answer:
The sample space of a fair coin flip is {H, T}. The sample space of a sequence of three fair coin flips is all 23 possible sequences of outcomes: {HHH,HHT,HTH,HTT,THH,THT,TTH,TTT}. The sample space of a sequence of five fair coin flips in which at least four flips are heads is {HHHHH,HHHHT,HHHTH,HHTHH,HTHHH,THHHH}.
EXPLORATION 2
Finding the Sample Space of an Experiment
Work with a partner. List the possible outcomes in the sample space of the experiment.

Answer:
a)1,2,3,4,5,6
b) Total 36

EXPLORATION 3
Finding the Sample Space of an Experiment
Work with a partner. In an experiment, a spinner is spun.
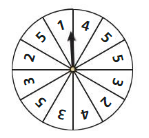
a. How many ways can you spin a 1? 2? 3? 4? 5?
Answer: 1, 2, 3, 2, 4
b. List the sample space.
Answer: 1, 2, 2, 3, 3, 3, 4, 4, 5, 5, 5, 5
c. What is the total number of outcomes?
Answer: 12
EXPLORATION 4
Finding the Sample Space of an Experiment
Work with a partner. In an experiment, a bag contains 2 blue marbles and 5 red marbles. Two marbles are drawn from the bag.
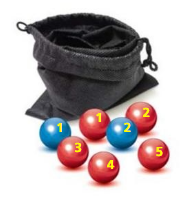
a. How many ways can you choose two blue? a red then blue? a blue then red? two red?
Answer: BB – 2, RB – 10, BR – 10, RR – 20
b. List the sample space.
c. What is the total number of outcomes?
Answer: 42
Communicate Your Answer
Question 5.
How can you list the possible outcomes in the sample space of an experiment?
Answer:
There are four possible outcomes for each spin: red, blue, yellow, green. Then, multiply the number of outcomes by the number of spins. June flipped the coin three times. The answer is there are 12 outcomes in the sample space
Question 6.
For Exploration 3, find the ratio of the number of each possible outcome to the total number of outcomes. Then find the sum of these ratios. Repeat for Exploration 4. What do you observe?
Answer:
Number 1 could be spun in 1 way, out of a total of 12 ways
r1 = 1/12
Number 2 could be spun in 2 way, out of a total of 12 ways
r2 = 2/12
Number 3 could be spun in 3 way, out of a total of 12 ways
r3 = 3/12
Number 4 could be spun in 2 way, out of a total of 12 ways
r4 = 2/12
Number 5 could be spun in 4 way, out of a total of 12 ways
r5 = 4/12
The sum of the ratios r1, r2, r3, r4 and r5 is
1/12 + 2/12 + 3/12 + 2/12 + 4/12 = 1
Two red balls can be drawn in 20 ways, out of a total of 42 ways
rBB = 20/42
Red then Blue can be drawn in 10 ways, out of a total of 42 ways
rRB = 10/42
Blue then Red can be drawn in 10 ways, out of a total of 42 ways
rRB = 10/42
Two Red balls can be drawn in 2 ways, out of a total of 42 ways
rRR = 2/42
20/42 + 10/42 + 10/42 + 2/42 = 1
Thus the sum of both explorations are same.
Monitoring Progress
Find the number of possible outcomes in the sample space. Then list the possible outcomes.
Question 1.
You flip two coins.
Answer:
Give that flipping two coins, there are four possible outcomes
Explanation: All of the outcomes of this experiment are shown below pictorially.
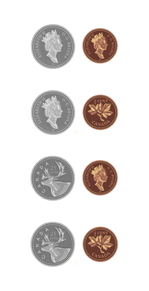
-All of the outcomes of this experiment are shown below as a list .
if “H” represent getting a head , and “T” represents getting a tail ;
the following represent all of outcomes:
(HH,HT,TH,TT)
Question 2.
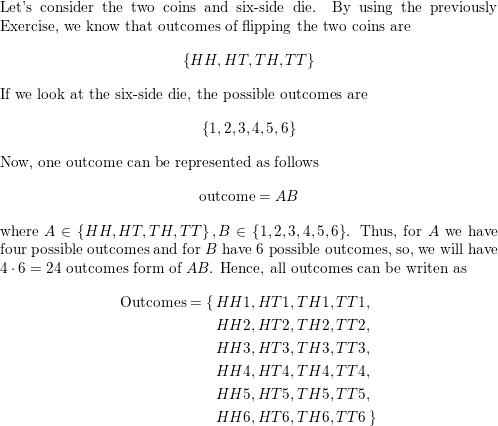
You flip two coins and roll a six-sided die.
Answer:
Question 3.
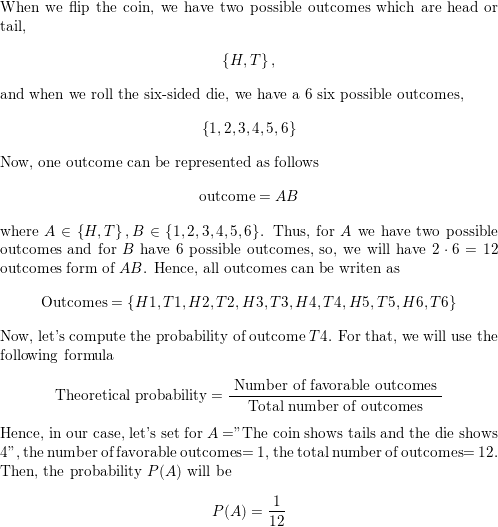
You flip a coin and roll a six-sided die. What is the probability that the coin shows tails and the die shows 4?
Answer:
Find P(\(\bar{A}\)).
Question 4.
P(A) = 0.455.
Answer:

Question 5.
P(A) = \(\frac{1}{4}\)
Answer:
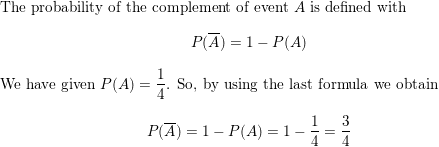
Question 6.
P(A) = 1
Answer:

Question 7.
P(A) = 0.03
Answer:

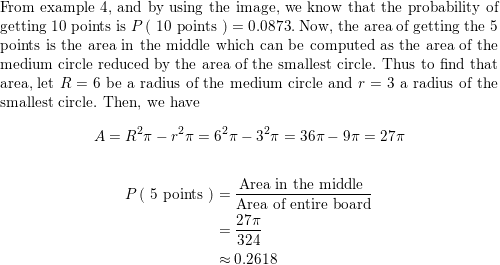
Question 8.
In Example 4, are you more likely to get 10 points or 5 points?
Answer:
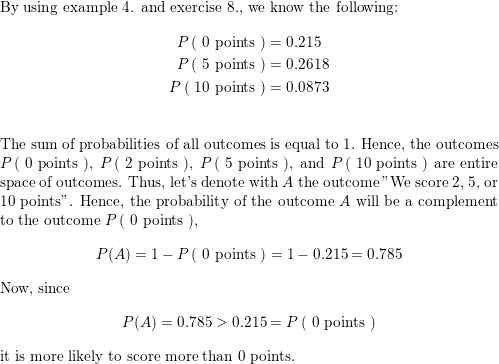
Question 9.
In Example 4, are you more likely to score points (10, 5, or 2) or get 0 points?
Answer:
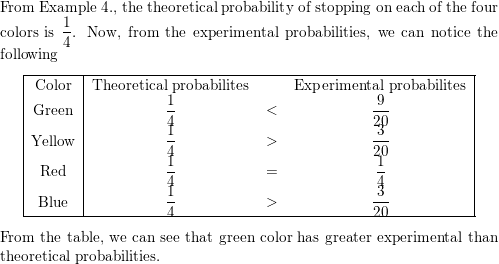
Question 10.
In Example 5, for which color is the experimental probability of stopping on the color greater than the theoretical probability?
Answer:
Question 11.
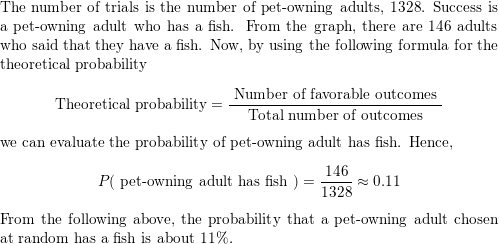
In Example 6, what is the probability that a pet-owning adult chosen at random owns a fish?
Answer:
Sample Spaces and Probability 10.1 Exercises
Vocabulary and Core Concept Check
Question 1.
COMPLETE THE SENTENCE
A number that describes the likelihood of an event is the __________ of the event.
Answer:

Question 2.
WRITING
Describe the difference between theoretical probability and experimental probability.
Answer:
Theoretical probability is when the outcomes are equally likely and can be found using a formula. Experimental probability is found with repeated trials of an experiment.
Theoretical probability is when the outcomes are equally likely and can be found using a formula.
Experimental probability is found with repeated trials of an experiment.
Monitoring Progress and Modeling with Mathematics
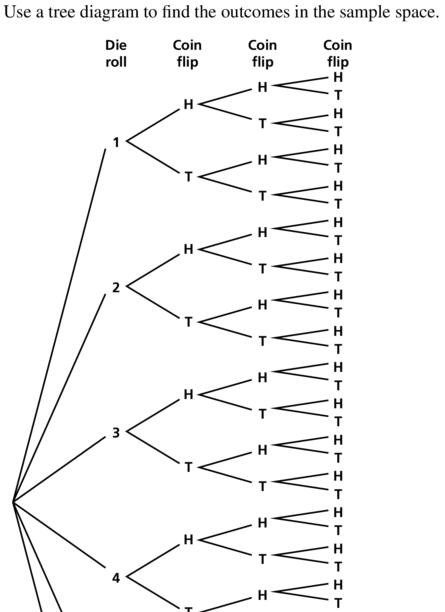
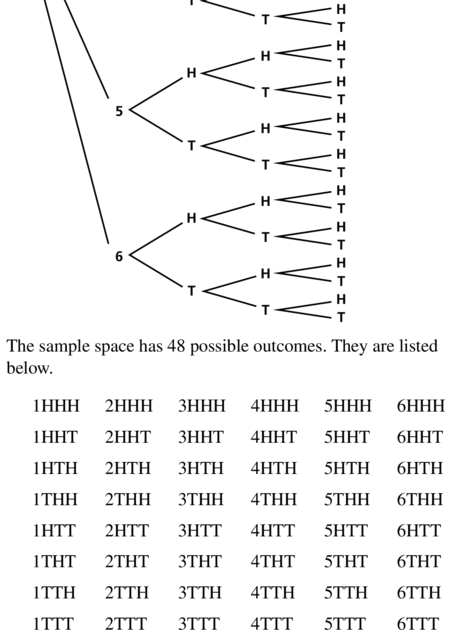
In Exercises 3–6, find the number of possible outcomes in the sample space. Then list the possible outcomes.
Question 3.
You roll a die and flip three coins.
Answer:
Question 4.
You flip a coin and draw a marble at random from a bag containing two purple marbles and one white marble.
Answer:

Question 5.
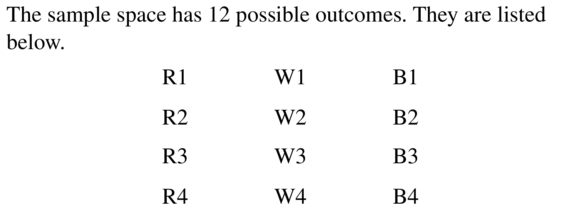
A bag contains four red cards numbered 1 through 4, four white cards numbered 1 through 4, and four black cards numbered 1 through 4. You choose a card at random.
Answer:
Question 6.
You draw two marbles without replacement from a bag containing three green marbles and four black marbles.
Answer:
There possibilities add up to four.
Explanation:
If you draw different colored marbles. there are two possibilities. You either draw green first and black second , or the other way around.
If you draw same colored marbles, there are two more possibilities. They are either both green or both black . There possibilities add up to four.
Question 7.
PROBLEM SOLVING
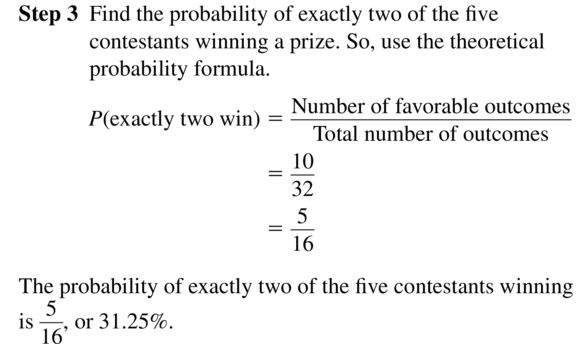
A game show airs on television five days per week. Each day, a prize is randomly placed behind one of two doors. The contestant wins the prize by selecting the correct door. What is the probability that exactly two of the five contestants win a prize during a week?
Answer:
Question 8.
PROBLEM SOLVING
Your friend has two standard decks of 52 playing cards and asks you to randomly draw one card from each deck. What is the probability that you will draw two spades?
Answer:
The probability is 1/16.
Explanation:
To get the possibility we need to calculate the possibility of drawing a spade from each deck, then we need to multiply those two possibilities .
There are 13 spades in a standard deck , so the possibility of drawing a spade is 13/52.
This is the possibility of drawing a spade from the first deck and the second deck individually . We multiply these possibilities to get the possibility of drawing spades from both decks after each others.
13/52 . 13/52 = 1/16.
The probability is 1/16.
Question 9.
PROBLEM SOLVING
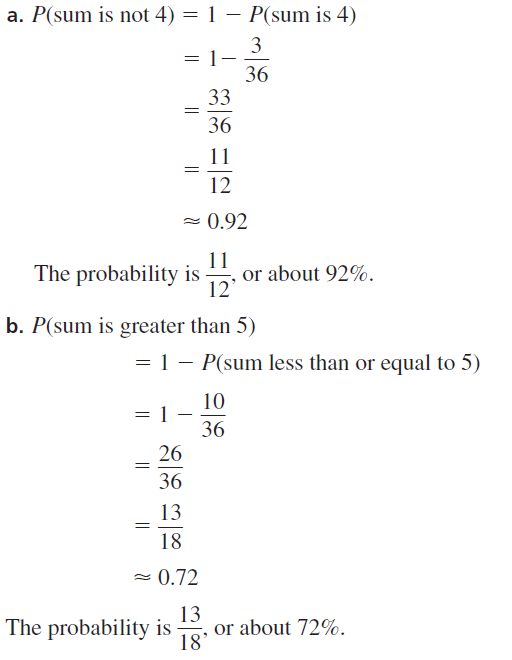
When two six-sided dice are rolled, there are 36 possible outcomes. Find the probability that (a) the sum is not 4 and (b) the sum is greater than 5.
Answer:
Question 10.
PROBLEM SOLVING
The age distribution of a population is shown. Find the probability of each event.
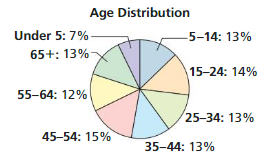
a. A person chosen at random is at least 15 years old.
b. A person chosen at random is from 25 to 44 years old.
Answer:
a)For this we will calculate the complementary probability. The probability of someone being under 5 is 0.07.
The probability of someone being between 5 and 14 is 0.13. To get the probability of a random person being over 15 we will
add these probabilities up and substract them from 1.
1-(0.07+0.13)=0.8
The probability of a random person being at least 15 is 0.8.
b) To calculate this probability we add up the probability of someone being between 25 and 34, and 35 and 44 . Both possibilities are 0.13.
0.13+0.13=0.26
The probability of someone being between 25 and 44 is 0.26.
Question 11.
ERROR ANALYSIS
A student randomly guesses the answers to two true-false questions. Describe and correct the error in finding the probability of the student guessing both answers correctly.

Answer:

Question 12.
ERROR ANALYSIS
A student randomly draws a number between 1 and 30. Describe and correct the error in finding the probability that the number drawn is greater than 4.
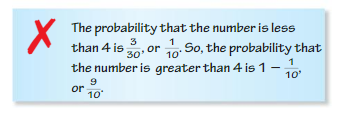
Answer:
The probability is 13/15.
Explanation:
To calculate the complementary probability we are looking for the probability of a number being less or equal to 4.
The probability of this is 4/30. Now we can substract this value from 1
1-4/30= 13/15.
Question 13.
MATHEMATICAL CONNECTIONS
You throw a dart at the board shown. Your dart is equally likely to hit any point inside the square board. What is the probability your dart lands in the yellow region?
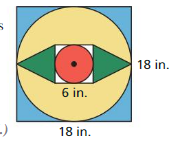
Answer:
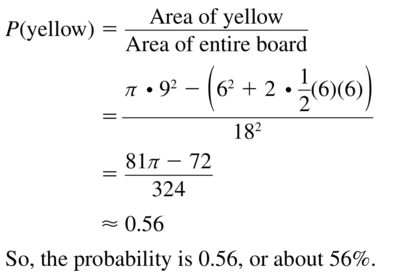
Question 14.
MATHEMATICAL CONNECTIONS
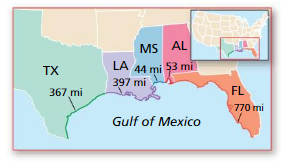
The map shows the length (in miles) of shoreline along the Gulf of Mexico for each state that borders the body of water. What is the probability that a ship coming ashore at a random point in the Gulf of Mexico lands in the given state?
a. Texas
b. Alabama
c. Florida
d. Louisiana
Answer:
First , from the given image. let’s define the length of shoreline for each state:
Texas=367mi
Louisiana= 397mi
Alabama=53mi
Florida=770mi
Mississippi=44mi
Explanation:
Total length of shoreline =367+397+56+770+44=1631mi
By using formula
P(The ship land in three state)= shoreline length of the state/Total length of shoreline
We can determine the probability that a ship coming ashore at a random point in the gulf of Mexico lands in the given state.
2)
a)P(The ship lands in Texas )=shoreline length of the Texas/Total length of shoreline=367/1631 =0.23 =23%
b)P(The ship lands in Alabama)=shoreline length of the Alabama/Total length of shoreline =53/1631=0.03=3%
c)P(The ship lands in Florida ) = shore length of the Florida /Total length of shoreline =770/1631=0.47=47%
d)P(The ship lands in Louisiana)= shore length of the Louisiana/Total length of shoreline=397/1631=0.24=24%
Question 15.
DRAWING CONCLUSIONS
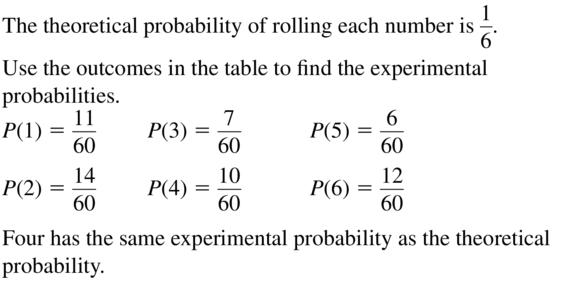
You roll a six-sided die 60 times. The table shows the results. For which number is the experimental probability of rolling the number the same as the theoretical probability?

Answer:
Question 16.
DRAWING CONCLUSIONS
A bag contains 5 marbles that are each a different color. A marble is drawn, its color is recorded, and then the marble is placed back in the bag. This process is repeated until 30 marbles have been drawn. The table shows the results. For which marble is the experimental probability of drawing the marble the same as the theoretical probability?

Answer: Black
Explanation:
Each draw , every color has a 1/5 probability of being drawn. We expand this number, so the denominator is 30 , since this is the number of total draws, 6/30, which tells us that theoretically a color should be draw six times, to the color black therefore that is the one that has the same experimental probability as theoretical probability.The only color that was drawn six times is the color , therefore that is the one that has the same experimental probability as theoretical probability
Question 17.
REASONING
Refer to the spinner shown. The spinner is divided into sections with the same area.
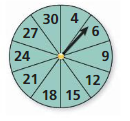
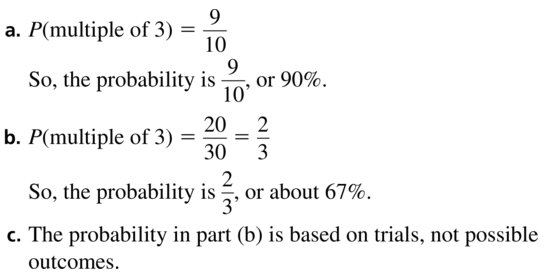
a. What is the theoretical probability that the spinner stops on a multiple of 3?
b. You spin the spinner 30 times. It stops on a multiple of 3 twenty times. What is the experimental probability of stopping on a multiple of 3?
c. Explain why the probability you found in part (b) is different than the probability you found in part (a).
Answer:
Question 18.
OPEN-ENDED
Describe a real-life event that has a probability of 0. Then describe a real-life event that has a probability of 1.
Answer:
The probability of rolling a 7 with a standard 6-sided die =0.
The probability of rolling a natural number with a standard 6 – sided die =1
Question 19.
DRAWING CONCLUSIONS
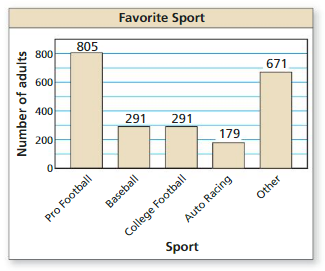
A survey of 2237 adults ages 18 and over asked which sport is their favorite. The results are shown in the figure. What is the probability that an adult chosen at random prefers auto racing?
Answer:

Question 20.
DRAWING CONCLUSIONS
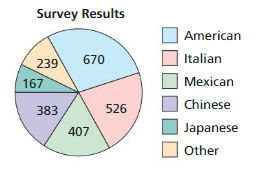
A survey of 2392 adults ages 18 and over asked what type of food they would be most likely to choose at a restaurant. The results are shown in the figure. What is the probability that an adult chosen at random prefers Italian food?
Answer:
Italian = 526
Explanation:
To get the probability of this happening, we need to divide the number of events that satisfy this event by the number of total events
526/2392=0.22
Question 21.
ANALYZING RELATIONSHIPS
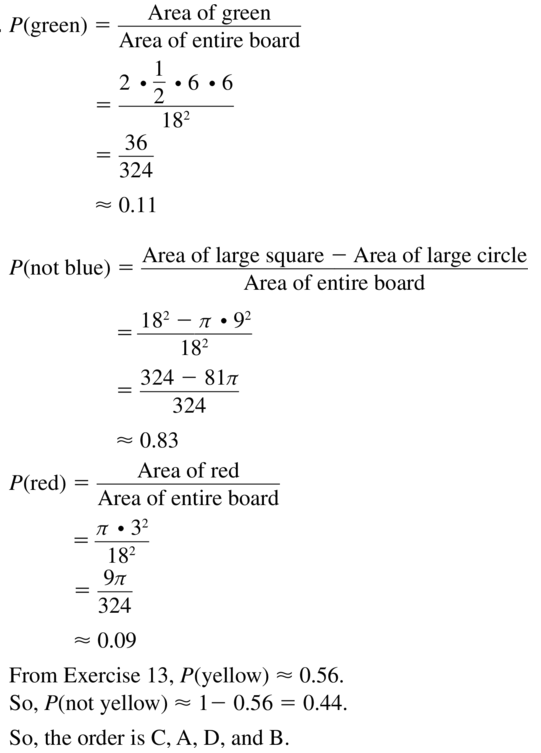
Refer to the board in Exercise 13. Order the likelihoods that the dart lands in the given region from least likely to most likely.
A. green
B. not blue
C. red
D. not yellow
Answer:
Question 22.
ANALYZING RELATIONSHIPS
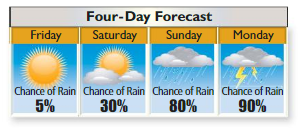
Refer to the chart below. Order the following events from least likely to most likely.
A. It rains on Sunday.
B. It does not rain on Saturday.
C. It rains on Monday.
D. It does not rain on Friday.
Answer: P(B)<P(A)<P(C)<P(D)
Explanation:
A. The probability it rains on Sunday is 80%= 0.8 ;P(a)=0.8
B. The probability it rains on Saturday is 30%=0.3,so the probability that it doesn’t rain on Saturday is 1- 0.3=0.7 ;P(B)=0.7.
C. The probability it rains on Monday is 90 %=0.9; P (c)=0.9
D. The probability it rains on Friday is 5% =0.05 So, the probability that it doesn’t rain on Saturday is 1-0.05= 0.95 ; P(D)=0.95
Question 23.
USING TOOLS
Use the figure in Example 3 to answer each question.
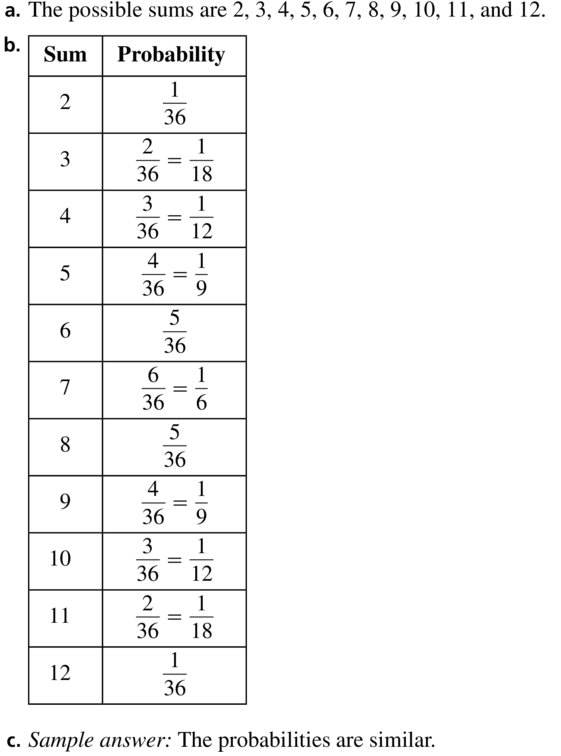
a. List the possible sums that result from rolling two six-sided dice.
b. Find the theoretical probability of rolling each sum.
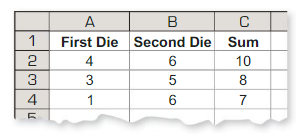
c. The table below shows a simulation of rolling two six-sided dice three times. Use a random number generator to simulate rolling two six-sided dice 50 times. Compare the experimental probabilities of rolling each sum with the theoretical probabilities.
Answer:
Question 24.
MAKING AN ARGUMENT
You flip a coin three times. It lands on heads twice and on tails once. Your friend concludes that the theoretical probability of the coin landing heads up is P(heads up) = \(\frac{2}{3}\). Is your friend correct? Explain your reasoning.
Answer:
The friend is wrong.
Explanation:
The theoretical probability that a coin lands on heads is 1/2. What the friend computed is the experimental probability, thus he is not correct.
Question 25.
MATHEMATICAL CONNECTIONS
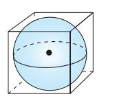
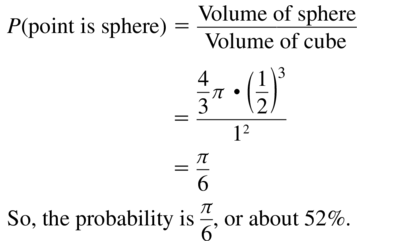
A sphere fits inside a cube so that it touches each side, as shown. What is the probability a point chosen at random inside the cube is also inside the sphere?
Answer:
Question 26.
HOW DO YOU SEE IT?
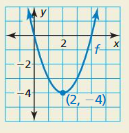
Consider the graph of f shown. What is the probability that the graph of y = f (x) +c intersects the x-axis when c is a randomly chosen integer from 1 to 6? Explain.
Answer:
Given that y=f(x)+c intersect x- axis
Explanation
The graph will intersect the x-axis if c is either 1,2,3, or 4, These are 4 events out of six, therefore the possible is 4/6 = 2/3
Question 27.
DRAWING CONCLUSIONS
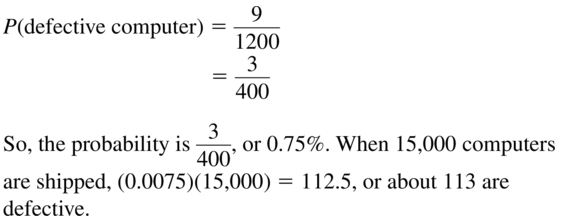
A manufacturer tests 1200 computers and finds that 9 of them have defects. Find the probability that a computer chosen at random has a defect. Predict the number of computers with defects in a shipment of 15,000 computers. Explain your reasoning.
Answer:
Question 28.
THOUGHT PROVOKING
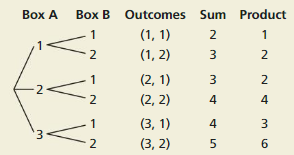
The tree diagram shows a sample space. Write a probability problem that can be represented by the sample space. Then write the answer(s) to the problem.
Answer:
Maintaining Mathematical Proficiency
Find the product or quotient.
Question 29.
\(\frac{3 x}{y} \cdot \frac{2 x^{3}}{y^{2}}\)
Answer:

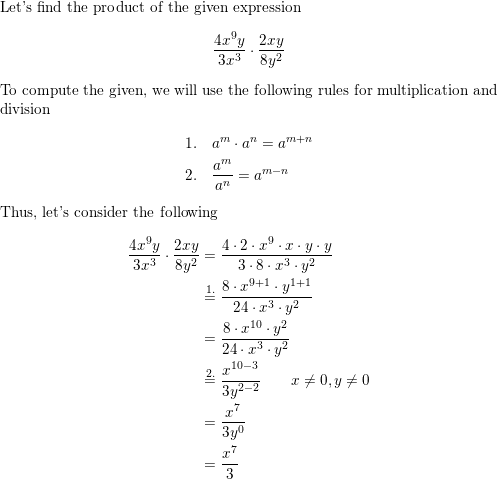
Question 30.
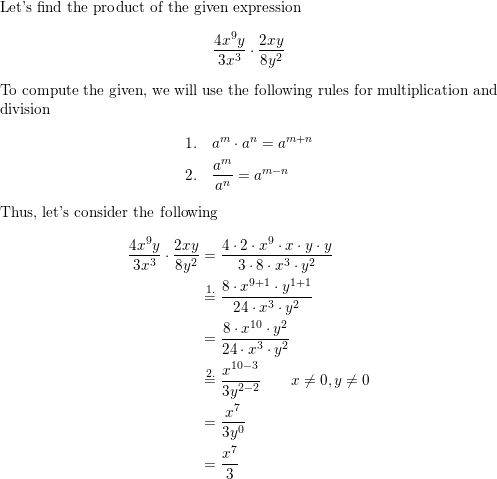
\(\frac{4 x^{9} y}{3 x^{3}} \cdot \frac{2 x y}{8 y^{2}}\)
Answer:
Question 31.
\(\frac{x+3}{x^{4}-2}\) • (x2 − 7x + 6)
Answer:
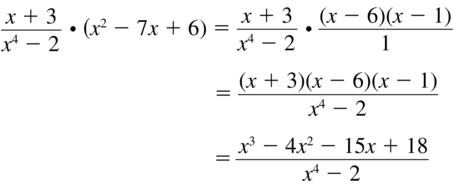
Question 32.
\(\frac{2 y}{5 x} \div \frac{y}{6 x}\)
Answer:
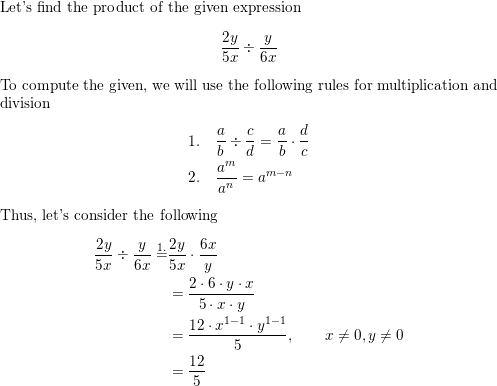
Question 33.
\(\frac{3 x}{12 x-11} \div \frac{x+1}{5 x}\)
Answer:
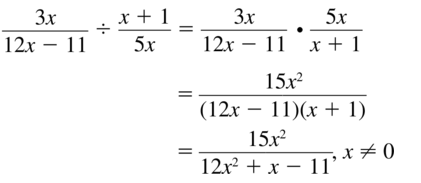
Question 34.
\(\frac{3 x^{2}+2 x-13}{x^{4}}\) ÷ (x2 + 9)
Answer:
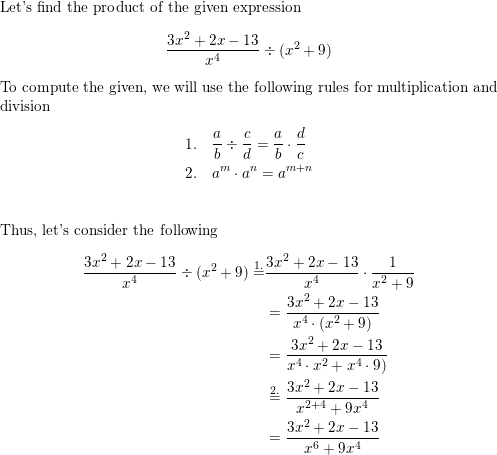
Lesson 10.2 Independent and Dependent Events
Essential Question How can you determine whether two events are independent or dependent?
Two events are independent events when the occurrence of one event does not affect the occurrence of the other event. Two events are dependent events when the occurrence of one event does affect the occurrence of the other event.
EXPLORATION 1
Identifying Independent and Dependent Events
Work with a partner. Determine whether the events are independent or dependent. Explain your reasoning.
a. Two six-sided dice are rolled.
Answer:
P = Number of outcomes that satisfy the requirements/Total number of possible outcomes
Probability for rolling two dice with the six sided dots such as 1, 2, 3, 4, 5 and 6 dots in each die.
When two dice are thrown simultaneously, thus the number of event can be 62 = 36 because each die has 1 to 6 number on its faces.
This is independent event
b. Six pieces of paper, numbered 1 through 6, are in a bag. Two pieces of paper are selected one at a time without replacement.
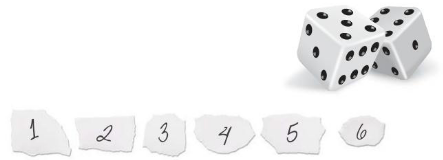
Answer:
P = Number of outcomes that satisfy the requirements/Total number of possible outcomes
When we pick up any paper the probability result is equal of 1/6
This is dependent event
EXPLORATION 2
Finding Experimental Probabilities
Work with a partner.
a. In Exploration 1(a), experimentally estimate the probability that the sum of the two numbers rolled is 7. Describe your experiment.
Answer:
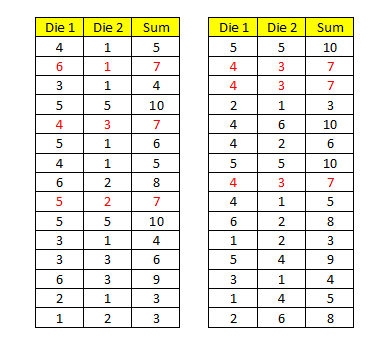
The experimental probability that the sum of two number rolled is 7
P(sum = 7) = 3/30 = 1/10 = 10%
b. In Exploration 1(b), experimentally estimate the probability that the sum of the two numbers selected is 7. Describe your experiment.
Answer:
One possible experiment is, that the numbers 1 to 6, were written on pieces of paper and placed in a box or container. One event means selecting a number followed by another, and add them. I tried the experiment 30 times and the results are listed below.
| Paper 1 | Paper 2 | Sum |
| 1 | 2 | 3 |
| 1 | 3 | 4 |
| 1 | 4 | 5 |
| 1 | 5 | 6 |
| 1 | 6 | 7 |
| 2 | 1 | 3 |
| 2 | 3 | 5 |
| 2 | 4 | 6 |
| 2 | 5 | 7 |
| 2 | 6 | 8 |
| 3 | 1 | 4 |
| 3 | 2 | 5 |
| 3 | 4 | 7 |
| 3 | 5 | 8 |
| 3 | 6 | 9 |
| 4 | 1 | 5 |
| 4 | 2 | 6 |
| 4 | 3 | 7 |
| 4 | 5 | 9 |
| 4 | 6 | 10 |
| 5 | 1 | 6 |
| 5 | 2 | 7 |
| 5 | 3 | 8 |
| 5 | 4 | 9 |
| 5 | 6 | 11 |
| 6 | 1 | 7 |
| 6 | 2 | 8 |
| 6 | 3 | 9 |
| 6 | 4 | 10 |
| 6 | 5 | 11 |
The experimental probability that the sum of the two numbers selected is 7,
P(Sum = 7) = 6/30 = 1/5 = 20%
EXPLORATION 3
Finding Theoretical Probabilities
Work with a partner.
a. In Exploration 1(a), find the theoretical probability that the sum of the two numbers rolled is 7. Then compare your answer with the experimental probability you found in Exploration 2(a).
Answer:
For each of the possible outcomes add the numbers on the two dice and count how many times this sum is 7. If you do so you will find that the sum is 7 for 6 of the possible outcomes. Thus the sum is a 7 in 6 of the 36 outcomes and hence the probability of rolling a 7 is 6/36 = 1/6.
b. In Exploration 1(b), find the theoretical probability that the sum of the two numbers selected is 7. Then compare your answer with the experimental probability you found in Exploration 2(b).
c. Compare the probabilities you obtained in parts (a) and (b).
Communicate Your Answer
Question 4.
How can you determine whether two events are independent or dependent?
Answer:
Two events A and B are said to be independent if the fact that one event has occurred does not affect the probability that the other event will occur.
If whether or not one event occurs does affect the probability that the other event will occur, then the two events are said to be dependent.
Question 5.
Determine whether the events are independent or dependent. Explain your reasoning.
a. You roll a 4 on a six-sided die and spin red on a spinner.
Answer: Independent
b. Your teacher chooses a student to lead a group. chooses another student to lead a second group. and chooses a third student to lead a third group.
Answer: Dependent
Monitoring Progress
Question 1.
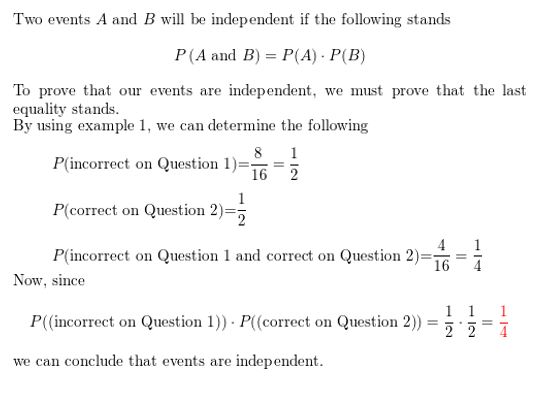
In Example 1, determine whether guessing Question 1 incorrectly and guessing Question 2 correctly are independent events.
Answer:
Question 2.
In Example 2, determine whether randomly selecting a girl first and randomly selecting a boy second are independent events.
Answer:
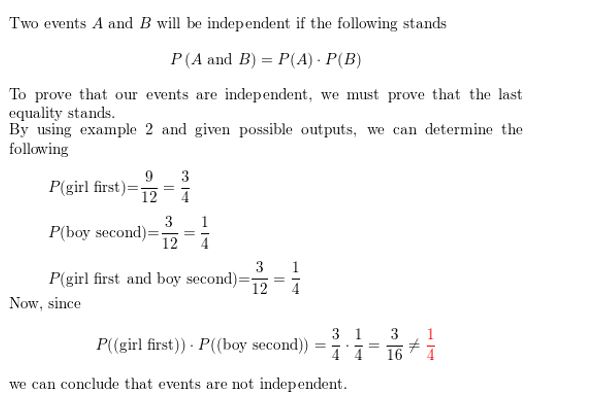
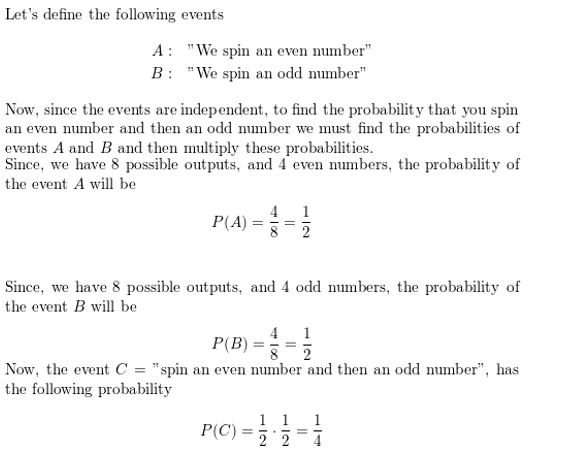
Question 3.
In Example 3, what is the probability that you spin an even number and then an odd number?
Answer:
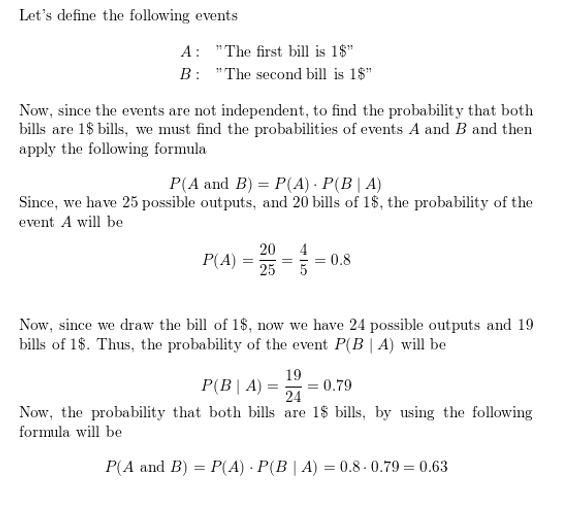
Question 4.
In Example 4, what is the probability that both bills are $1 bills?
Answer:
Question 5.
In Example 5, what is the probability that none of the cards drawn are hearts when (a) you replace each card, and (b) you do not replace each card? Compare the probabilities.
Answer:

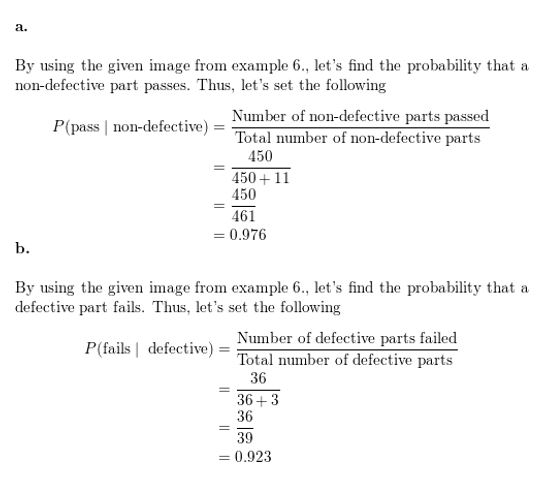
Question 6.
In Example 6, find (a) the probability that a non-defective part “passes,” and (b) the probability that a defective part “fails.”
Answer:
Question 7.
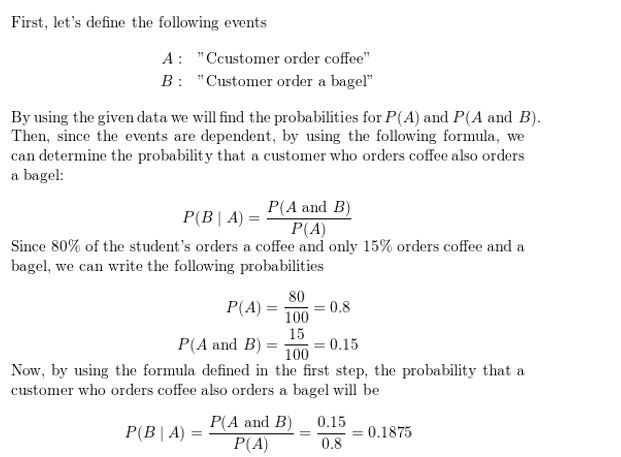
At a coffee shop, 80% of customers order coffee. Only 15% of customers order coffee and a bagel. What is the probability that a customer who orders coffee also orders a bagel?
Answer:
Independent and Dependent Events 10.2 Exercises
Vocabulary and Core Concept Check
Question 1.
WRITING
Explain the difference between dependent events and independent events, and give an example of each.
Answer:

Question 2.
COMPLETE THE SENTENCE
The probability that event B will occur given that event A has occurred is called the __________ of B given A and is written as _________
Answer: P(B/A)
Conditional probability refers to the chances that some outcome occurs given that another event has also occurred .
it is often stated as the probability of B given A and is written as P(B/A).
Monitoring Progress and Modeling with Mathematics
In Exercises 3–6, tell whether the events are independent or dependent. Explain your reasoning.
Question 3.
A box of granola bars contains an assortment of flavors. You randomly choose a granola bar and eat it. Then you randomly choose another bar.
Event A: You choose a coconut almond bar first.
Event B: You choose a cranberry almond bar second.
Answer:

Question 4.
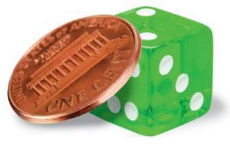
You roll a six-sided die and flip a coin.
Event A: You get a 4 when rolling the die.
Event B: You get tails when flipping the coin.
Answer:
The two event that considered in this experiment are on example of independent events.
The occurrence of the four in the throwing of the die does not influence the out come of
Tails in tossing of the coin.
The Two events that considered in this experiment are Independent Events.
Question 5.
Your MP3 player contains hip-hop and rock songs. You randomly choose a song. Then you randomly choose another song without repeating song choices.
Event A: You choose a hip-hop song first.
Event B: You choose a rock song second.

Answer:

Question 6.
There are 22 novels of various genres on a shelf. You randomly choose a novel and put it back. Then you randomly choose another novel.
Event A: You choose a mystery novel.
Event B: You choose a science fiction novel.
Answer:
Probability of event B is not affected by probability of event A.
The 1st book chosen is put back so the second book picked has the same probability of being chosen As if the 1st book was never chosen to begin with.
The Events are Independent.
In Exercises 7–10, determine whether the events are independent.
Question 7.
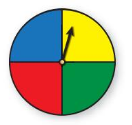
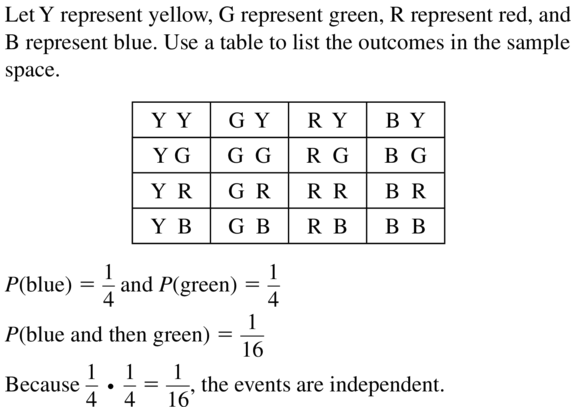
You play a game that involves spinning a wheel. Each section of the wheel shown has the same area. Use a sample space to determine whether randomly spinning blue and then green are independent events.
Answer:
Question 8.
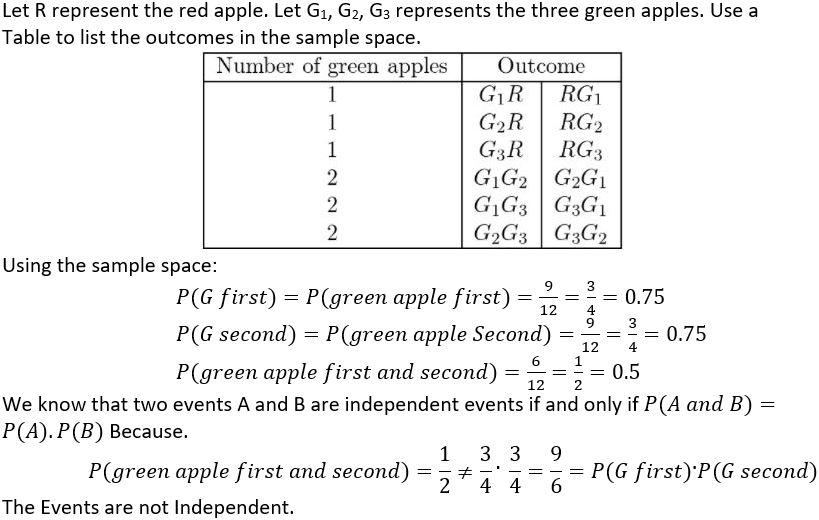
You have one red apple and three green apples in a bowl. You randomly select one apple to eat now and another apple for your lunch. Use a sample space to determine whether randomly selecting a green apple first and randomly selecting a green apple second are independent events.
Answer:
Question 9.
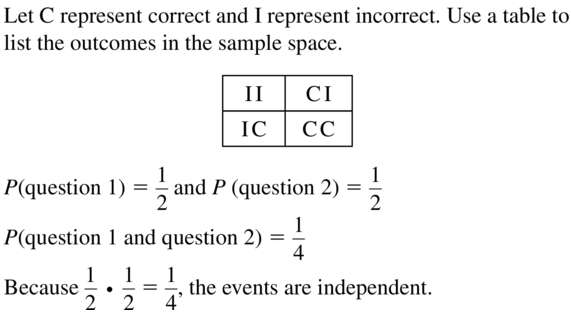
A student is taking a multiple-choice test where each question has four choices. The student randomly guesses the answers to the five-question test. Use a sample space to determine whether guessing Question 1 correctly and Question 2 correctly are independent events.
Answer:
Question 10.
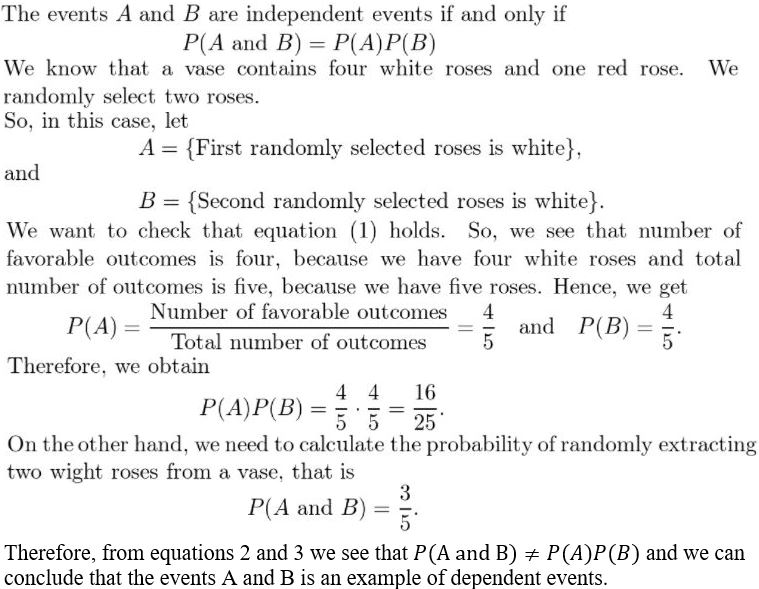
A vase contains four white roses and one red rose. You randomly select two roses to take home. Use a sample space to determine whether randomly selecting a white rose first and randomly selecting a white rose second are independent events.
Answer:
Question 11.
PROBLEM SOLVING
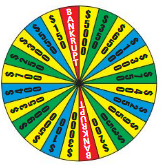
You play a game that involves spinning the money wheel shown. You spin the wheel twice. Find the probability that you get more than $500 on your first spin and then go bankrupt on your second spin.
Answer:
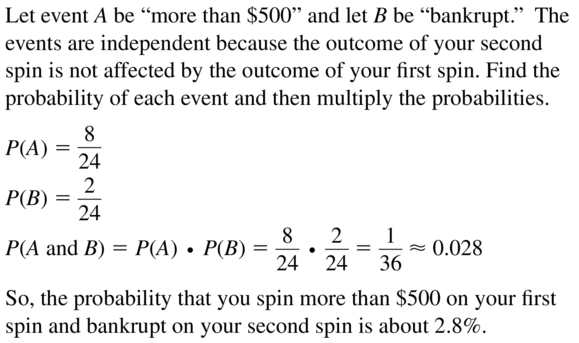
Question 12.
PROBLEM SOLVING
You play a game that involves drawing two numbers from a hat. There are 25 pieces of paper numbered from 1 to 25 in the hat. Each number is replaced after it is drawn. Find the probability that you will draw the 3 on your first draw and a number greater than 10 on your second draw.
Answer:
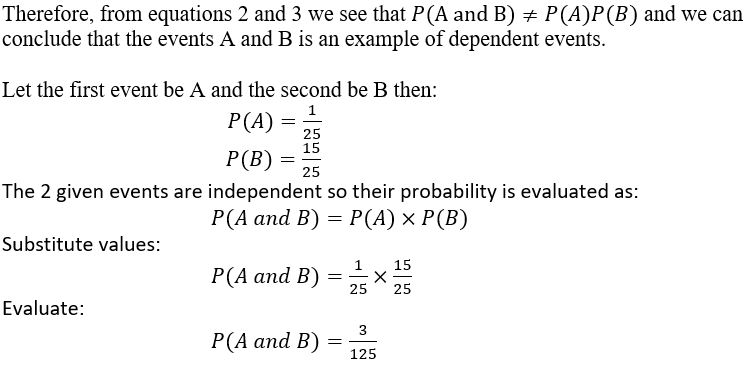
Question 13.
PROBLEM SOLVING
A drawer contains 12 white socks and 8 black socks. You randomly choose 1 sock and do not replace it. Then you randomly choose another sock. Find the probability that both events A and B will occur.
Event A: The first sock is white.
Event B: The second sock is white.
Answer:
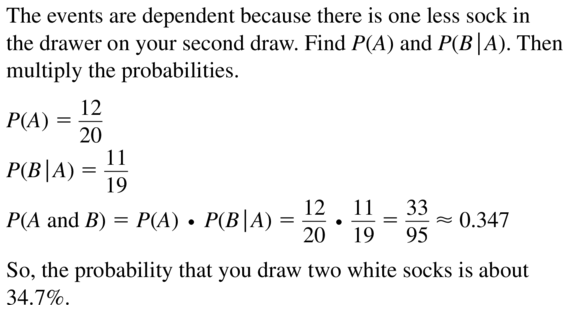
Question 14.
PROBLEM SOLVING
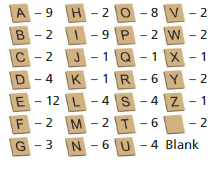
A word game has 100 tiles, 98 of which are letters and 2 of which are blank. The numbers of tiles of each letter are shown. Yourandomly draw 1 tile, set it aside, and then randomly draw another tile. Find the probability that both events A and B will occur.
Answer:
Consonants (A) = 56
Vowels (B) = 42
Blank = 2
Total letters = 100
Two letters are drawn with replacement.
P(A) = 56/100 = 0.56
P(B) = 42/(100-1) = 0.424
P(A).P(B) = 0.56*0.424 = 0.2376
Question 15.
ERROR ANALYSIS
Events A and B are independent. Describe and correct the error in finding P(A and B).

Answer:

Question 16.
ERROR ANALYSIS
A shelf contains 3 fashion magazines and 4 health magazines. You randomly choose one to read, set it aside, and randomly choose another for your friend to read. Describe and correct the error in finding the probability that both events A and B occur.
Event A: The first magazine is fashion.
Event B: The second magazine is health.

Answer:
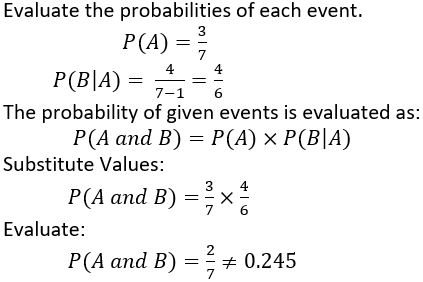
Question 17.
NUMBER SENSE
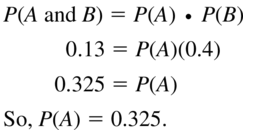
Events A and B are independent. Suppose P(B) = 0.4 and P(A and B) = 0.13. Find P(A).
Answer:
Question 18.
NUMBER SENSE
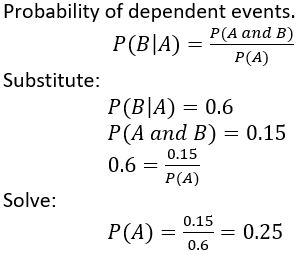
Events A and B are dependent. Suppose P(B | A) = 0.6 and P(A and B) = 0.15. Find P(A).
Answer:
Question 19.
ANALYZING RELATIONSHIPS
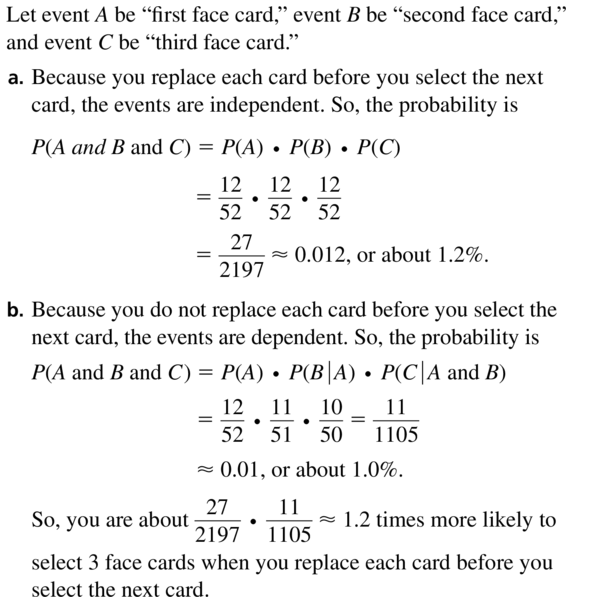
You randomly select three cards from a standard deck of 52 playing cards. What is the probability that all three cards are face cards when (a) you replace each card before selecting the next card, and (b) you do not replace each card before selecting the next card? Compare the probabilities.
Answer:
Question 20.
ANALYZING RELATIONSHIPS
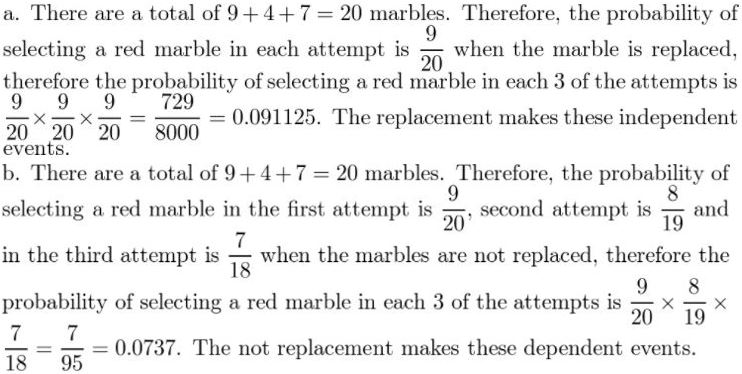
A bag contains 9 red marbles, 4 blue marbles, and 7 yellow marbles. You randomly select three marbles from the bag. What is the probability that all three marbles are red when (a) you replace each marble before selecting the next marble, and (b) you do not replace each marble before selecting the next marble? Compare the probabilities.
Answer:
Question 21.
ATTEND TO PRECISION
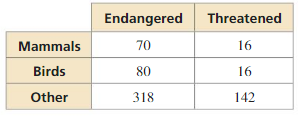
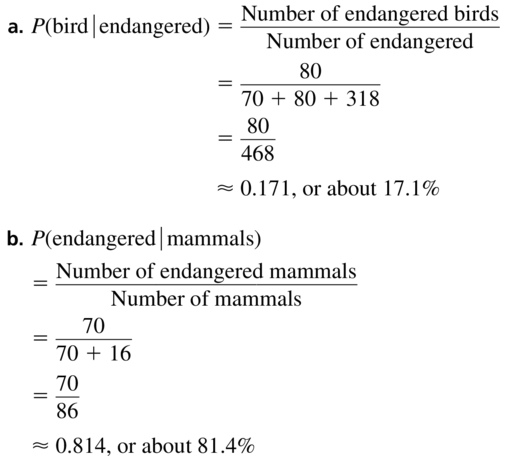
The table shows the number of species in the United States listed as endangered and threatened. Find (a) the probability that a randomly selected endangered species is a bird, and (b) the probability that a randomly selected mammal is endangered.
Answer:
Question 22.
ATTEND TO PRECISION
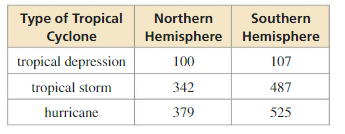
The table shows the number of tropical cyclones that formed during the hurricane seasons over a 12-year period. Find (a) the probability to predict whether a future tropical cyclone in the Northern Hemisphere is a hurricane, and (b) the probability to predict whether a hurricane is in the Southern Hemisphere.
Answer:
Let A be the event that a future tropical cyclone in the Northern Hemisphere is a hurricane.
There are 821 total cyclones in Northern hemisphere
Total outcomes = 821
Total number of hurricane cyclone in northern hemisphere is a hurricane
P(A) = 379/821 = 0.462
Question 23.
PROBLEM SOLVING
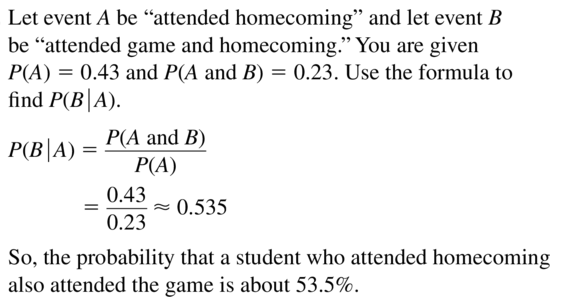
At a school, 43% of students attend the homecoming football game. Only 23% of students go to the game and the homecoming dance. What is the probability that a student who attends thefootball game also attends the dance?
Answer:
Question 24.
PROBLEM SOLVING
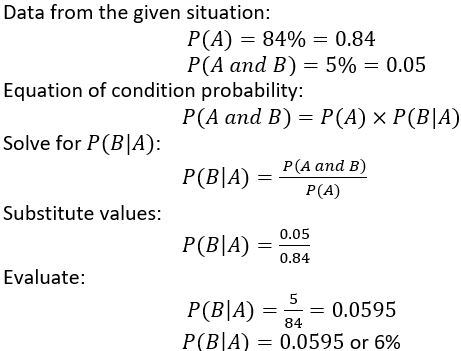
At a gas station, 84% of customers buy gasoline. Only 5% of customers buy gasoline and a beverage. What is the probability that a customer who buys gasoline also buys a beverage?
Answer:
Question 25.
PROBLEM SOLVING
You and 19 other students volunteer to present the “Best Teacher” award at a school banquet. One student volunteer will be chosen to present the award. Each student worked at least 1 hour in preparation for the banquet. You worked for 4 hours, and the group worked a combined total of 45 hours. For each situation, describe a process that gives you a “fair” chance to be chosen, and find the probability that you are chosen.
a. “Fair” means equally likely.
b. “Fair” means proportional to the number of hours each student worked in preparation.
Answer:

Question 26.
HOW DO YOU SEE IT?
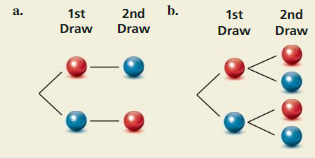
A bag contains one red marble and one blue marble. The diagrams show the possible outcomes of randomly choosing two marbles using different methods. For each method, determine whether the marbles were selected with or without replacement.
Answer:
It is given that a bag contains one red marble and one blue marble. The diagrams show the possible outcomes of randomly choosing two marbles using different methods.
As per the diagram, we observe that
If firstly red marble is drawn randomly, then we get blue marble on the 2nd draw.
Blue marble is drawn randomly, then we get red marble on the 2nd draw.
That means after choosing red marble we then get the blue marble only.
After choosing blue marble we then get the red marble only.
It means that red marble was not put back in the bag after getting selected.
Blue marble was not put back in the bag after getting selected.
b. We have to determine whether the marbles were selected with or without replacement, for each method.
“Without replacement ” means that you don’t put the ball or balls back in the box so that the number of balls in the box gets less as each ball is removed.
“With replacement ” means that you put the ball or balls back in the box.
According to the diagram, we can see that
If firstly, red marble is drawn randomly, then we get either red marble or blue marble on the 2nd draw.
If firstly, blue marble is drawn randomly, then we get also get either red marble or blue marble on the 2nd draw.
That means, after choosing red marble, we then get any of the marbles, either red or blue.
And, after choosing blue marble, we then also get any of the marbles, either red or blue.
That means red marble was put back in the bag after getting selected.
Similarly, blue marble was put back in the bag after getting selected.
This shows that marbles were selected “With Replacement” in each method.
Question 27.
MAKING AN ARGUMENT
A meteorologist claims that there is a 70% chance of rain. When it rains, there is a 75% chance that your softball game will be rescheduled. Your friend believes the game is more likely to be rescheduled than played. Is your friend correct? Explain your reasoning.
Answer:

Question 28.
THOUGHT PROVOKING
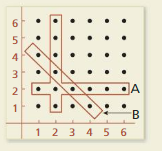
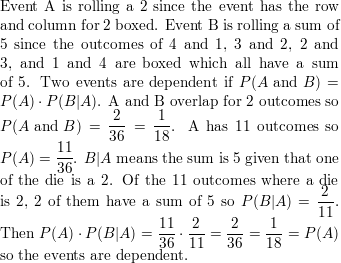
Two six-sided dice are rolled once. Events A and B are represented by the diagram. Describe each event. Are the two events dependent or independent? Justify your reasoning.
Answer:
Question 29.
MODELING WITH MATHEMATICS
A football team is losing by 14 points near the end of a game. The team scores two touchdowns (worth 6 points each) before the end of the game. After each touchdown, the coach must decide whether to go for 1 point with a kick (which is successful 99% of the time) or 2 points with a run or pass (which is successful 45% of the time).
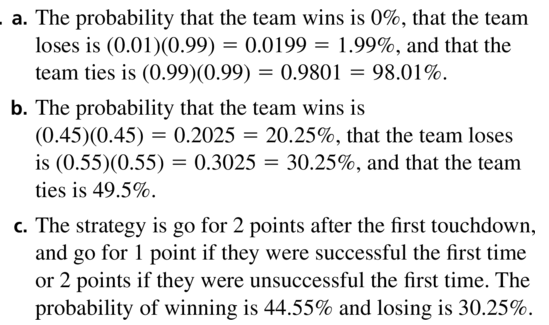
a. If the team goes for 1 point after each touchdown, what is the probability that the team wins? loses? ties?
b. If the team goes for 2 points after each touchdown, what is the probability that the team wins? loses? ties?
c. Can you develop a strategy so that the coach’s team has a probability of winning the game that is greater than the probability of losing? If so, explain your strategy and calculate the probabilities of winning and losing the game.
Answer:
Question 30.
ABSTRACT REASONING
Assume that A and B are independent events.
a. Explain why P(B) = P(B|A) and P(A) =P(A|B).
b. Can P(A and B) also be defined as P(B) • P(A|B)? Justify your reasoning.
Answer:
Maintaining Mathematical Proficiency
Solve the equation. Check your solution.
Question 31.
\(\frac{9}{10}\)x = 0.18
Answer:

Question 32.
\(\frac{1}{4}\)x + 0.5x = 1.5
Answer:

Question 33.
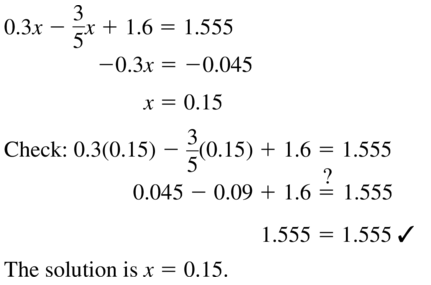
0.3x − \(\frac{3}{5}\)x + 1.6 = 1.555
Answer:
Lesson 10.3 Two-Way Tables and Probability
Essential Question How can you construct and interpret a two-way table?
EXPLORATION 1
Completing and Using a Two-Way Table
Work with a partner. A two-way table displays the same information as a Venn diagram. In a two-way table, one category is represented by the rows and the other category is represented by the columns.
The Venn diagram shows the results of a survey in which 80 students were asked whether they play a musical instrument and whether they speak a foreign language. Use the Venn diagram to complete the two-way table. Then use the two-way table to answer each question.

a. How many students play an instrument?
Answer: 41
b. How many students speak a foreign language?
Answer: 46
c. How many students play an instrument and speak a foreign language?
Answer: 16
d. How many students do not play an instrument and do not speak a foreign language?
Answer: 9
e. How many students play an instrument and do not speak a foreign language?
Answer: 25
EXPLORATION 2
Two-Way Tables and Probability
Work with a partner. In Exploration 1, one student is selected at random from the 80 students who took the survey. Find the probability that the student
a. plays an instrument.
Answer: 41/80
b. speaks a foreign language.
Answer: 46/80
c. plays an instrument and speaks a foreign language.
Answer: 16/80
d. does not play an instrument and does not speak a foreign language.
Answer: 9/80
e. plays an instrument and does not speak a foreign language.
Answer:
P = number of students plays an instrument and not speak a foreign language/number of students
P = 25/80 = 5/16
EXPLORATION 3
Conducting a Survey
Work with your class. Conduct a survey of the students in your class. Choose two categories that are different from those given in Explorations 1 and 2. Then summarize the results in both a Venn diagram and a two-way table. Discuss the results.
Answer:
On conducting survey of 50 students whether they like mathematics and whether they like history.
Out of 50 students, 12 students like math, 10 students like history, 16 students like both and 12 sudents neither like math nor history.
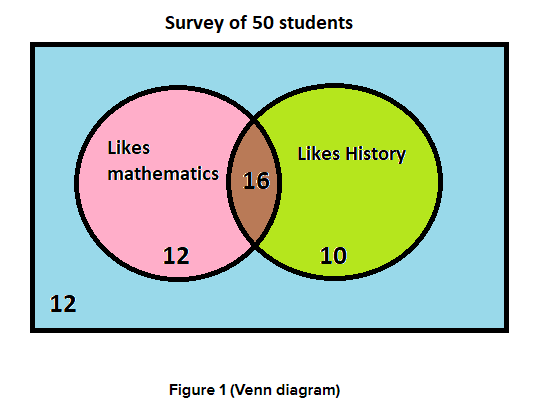
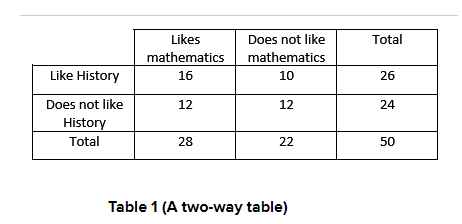
Now the Venn diagram and two-way table interpret that out of 50 students surveyed, 28 students like maths 22 does not like maths, 26 students like history and 24 do not like history.
Communicate Your Answer
Question 4.
How can you construct and interpret a two-way table?
Answer:
Identify the variables. There are two variables of interest here: the commercial viewed and opinion.
Determine the possible values of each variable. For the two variables, we can identify the following possible values
Set up the table
Fill in the frequencies
Question 5.
How can you use a two-way table to determine probabilities?
Answer:
- Count how many possible outcomes the first event has.
- Count how many possible outcomes the second event has.
- Draw a table with the appropriate number of rows and columns.
- Label the columns
- Label the rows.
Monitoring Progress
Question 1.
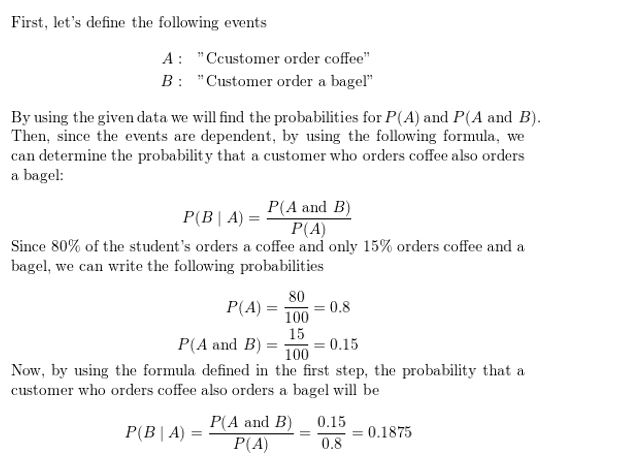
You randomly survey students about whether they are in favor of planting a community garden at school. Of 96 boys surveyed, 61 are in favor. Of 88 girls surveyed, 17 are against. Organize the results in a two-way table. Then find and interpret the marginal frequencies.
Answer:
Question 2.
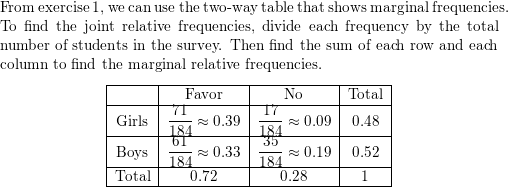
Use the survey results in Monitoring Progress Question 1 to make a two-way table that shows the joint and marginal relative frequencies.
Answer:
Question 3.
Use the survey results in Example 1 to make a two-way table that shows the conditional relative frequencies based on the column totals. Interpret the conditional relative frequencies in the context of the problem.
Answer:

Question 4.
Use the survey results in Monitoring Progress Question 1 to make a two-way table that shows the conditional relative frequencies based on the row totals. Interpret the conditional relative frequencies in the context of the problem.
Answer:

Question 5.
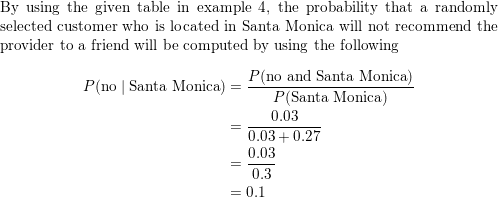
In Example 4, what is the probability that a randomly selected customer who is located in Santa Monica will not recommend the provider to a friend?
Answer:
Question 6.
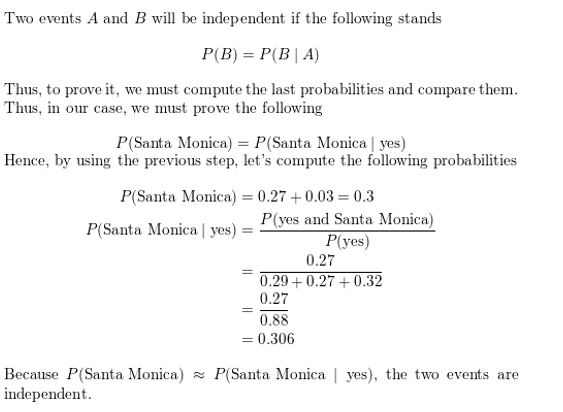
In Example 4, determine whether recommending the provider to a friend and living in Santa Monica are independent events. Explain your reasoning.
Answer:
Question 7.
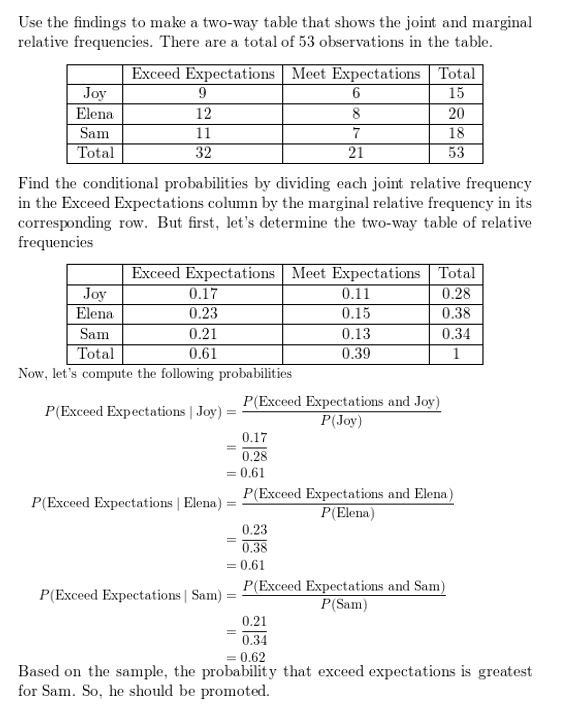
A manager is assessing three employees in order to offer one of them a promotion. Over a period of time, the manager records whether the employees meet or exceed expectations on their assigned tasks. The table shows the manager’s results. Which employee should be offered the promotion? Explain.
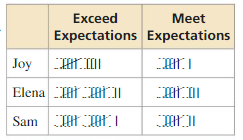
Answer:
Two-Way Tables and Probability 10.3 Exercises
Vocabulary and Core Concept Check
Question 1.
COMPLETE THE SENTENCE
A(n) _____________ displays data collected from the same source that belongs to two different categories.
Answer:

Question 2.
WRITING
Compare the definitions of joint relative frequency, marginal relative frequency, and conditional relative frequency.
Answer:
1.A joint relative frequency is the ratio of an entry in the table ( that is not a total)to the survey total .
2. A Marginal relative frequency is the sum of the joint relative frequency in row or column.
3.A Conditional relative frequency is the ration relative frequency to marginal relative frequency .
Monitoring Progress and Modeling with Mathematics
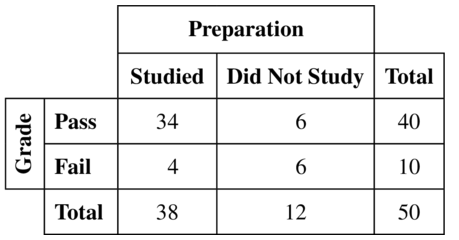
In Exercises 3 and 4, complete the two-way table.
Question 3.
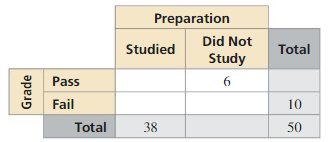
Answer:
Question 4.
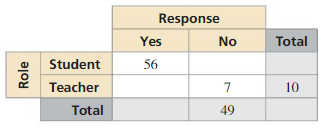
Answer:
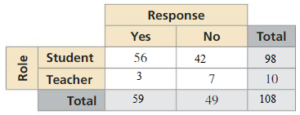
Number of students who said no is 49 – 7 = 42
Total number of students is 56 + 42 = 98
Total number of people is 98 + 10 = 108
Out of the total number of people, 49 of them said no,
Total number of people who said yes is 108 – 49 = 59
Number of teachers who said yes is 59 – 56 = 3
Question 5.
MODELING WITH MATHEMATICS
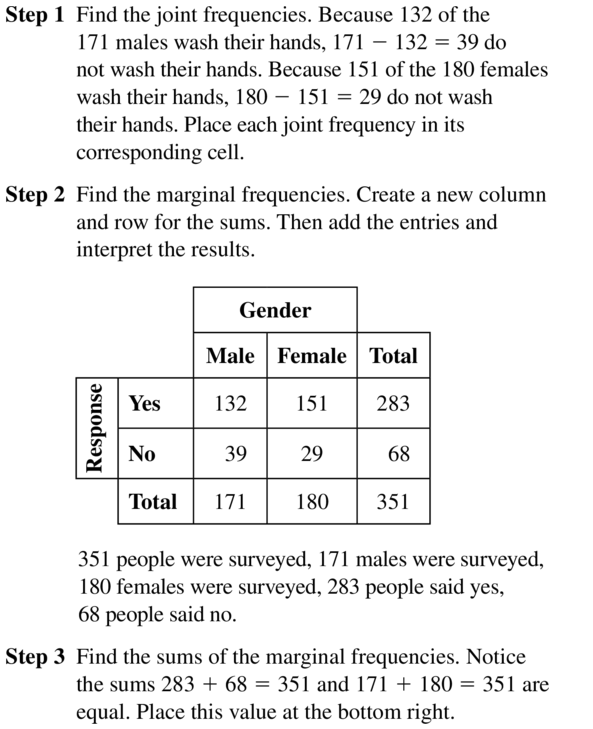
You survey 171 males and 180 females at Grand Central Station in New York City. Of those, 132 males and 151 females wash their hands after using the public rest rooms. Organize these results in a two-way table. Then find and interpret the marginal frequencies.

Answer:
Question 6.
MODELING WITH MATHEMATICS
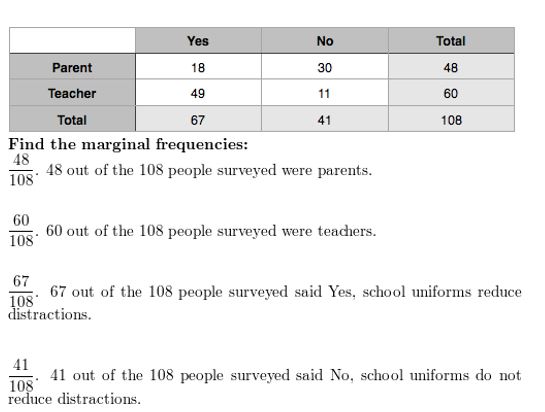
A survey asks 60 teachers and 48 parents whether school uniforms reduce distractions in school. Of those, 49 teachers and 18 parents say uniforms reduce distractions in school. Organize these results in a two-way table. Then find and interpret the marginal frequencies.
Answer:
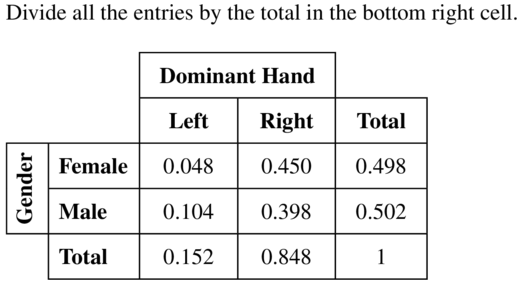
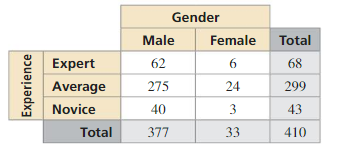
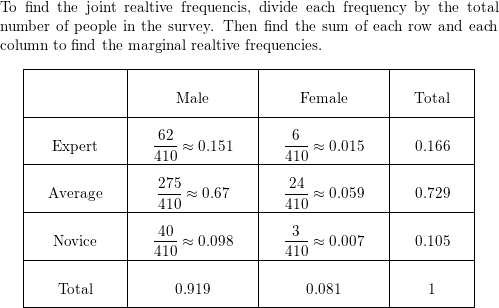
USING STRUCTURE In Exercises 7 and 8, use the two-way table to create a two-way table that shows the joint and marginal relative frequencies.
Question 7.
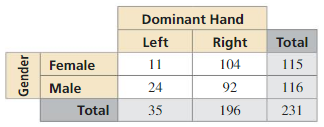
Answer:
Question 8.
Answer:
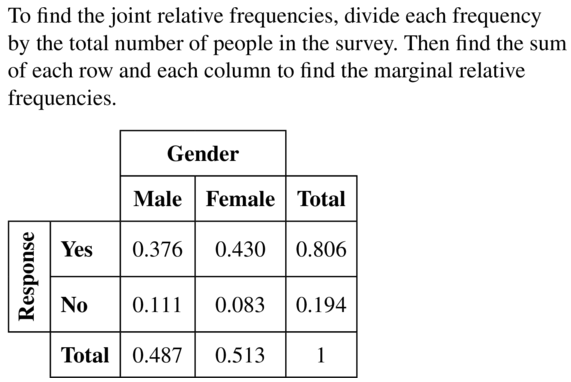
Question 9.
MODELING WITH MATHEMATICS
Use the survey results from Exercise 5 to make a two-way table that shows the joint and marginal relative frequencies.
Answer:
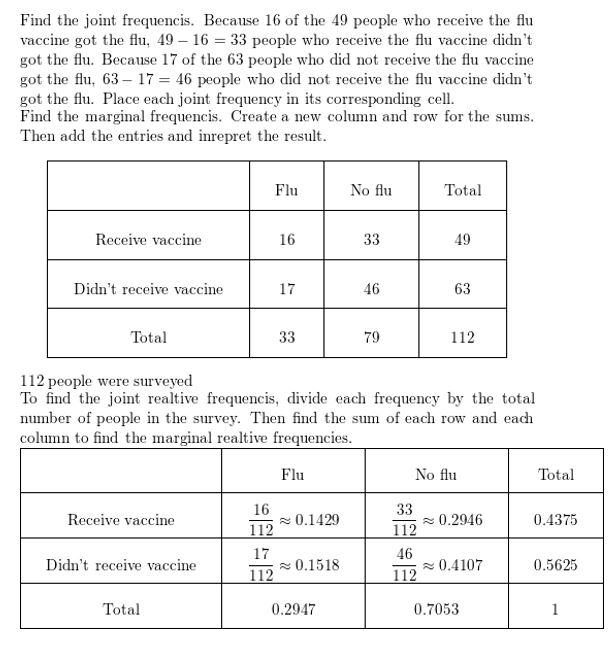
Question 10.
MODELING WITH MATHEMATICS
In a survey, 49 people received a flu vaccine before the flu season and 63 people did not receive the vaccine. Of those who receive the flu vaccine, 16 people got the flu. Of those who did not receive the vaccine, 17 got the flu. Make a two-way table that shows the joint and marginal relative frequencies.

Answer:
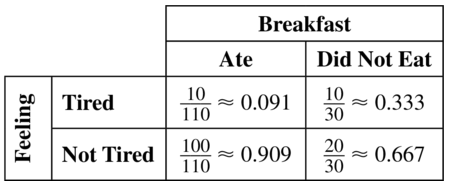
Question 11.
MODELING WITH MATHEMATICS
A survey finds that 110 people ate breakfast and 30 people skipped breakfast. Of those who ate breakfast, 10 people felt tired. Of those who skipped breakfast, 10 people felt tired. Make a two-way table that shows the conditional relative frequencies based on the breakfast totals.
Answer:
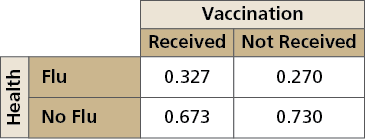
Question 12.
MODELING WITH MATHEMATICS
Use the survey results from Exercise 10 to make a two-way table that shows the conditional relative frequencies based on the flu vaccine totals.
Answer:
Question 13.
PROBLEM SOLVING
Three different local hospitals in New York surveyed their patients. The survey asked whether the patient’s physician communicated efficiently. The results, given as joint relative frequencies, are shown in the two-way table.

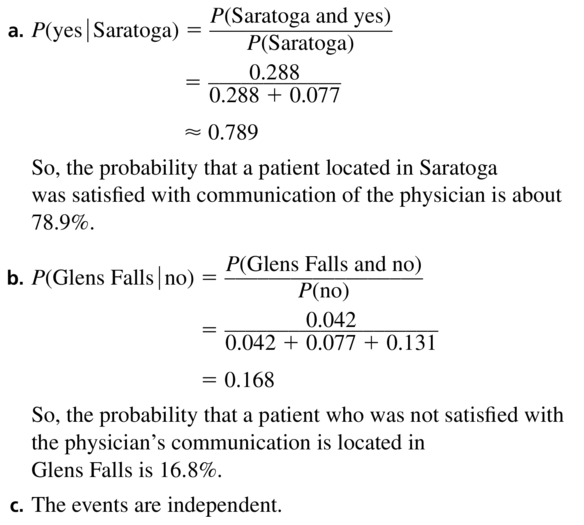
a. What is the probability that a randomly selected patient located in Saratoga was satisfied with the communication of the physician?
b. What is the probability that a randomly selected patient who was not satisfied with the physician’s communication is located in Glens Falls?
c. Determine whether being satisfied with the communication of the physician and living in Saratoga are independent events.
Answer:
Question 14.
PROBLEM SOLVING
A researcher surveys a random sample of high school students in seven states. The survey asks whether students plan to stay in their home state after graduation. The results, given as joint relative frequencies, are shown in the two-way table.
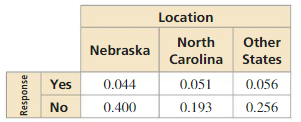
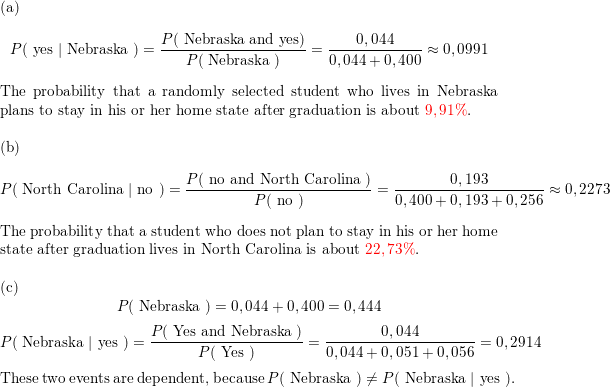
a. What is the probability that a randomly selected student who lives in Nebraska plans to stay in his or her home state after graduation?
b. What is the probability that a randomly selected student who does not plan to stay in his or her home state after graduation lives in North Carolina?
c. Determine whether planning to stay in their home state and living in Nebraska are independent events.
Answer:
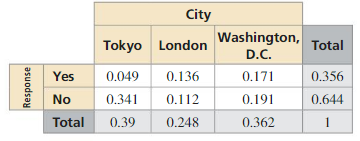
ERROR ANALYSIS In Exercises 15 and 16, describe and correct the error in finding the given conditional probability.
Question 15.
P(yes|Tokyo)
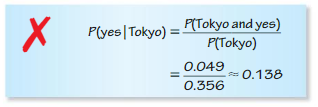
Answer:

Question 16.
P(London|no)
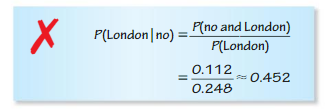
Answer:
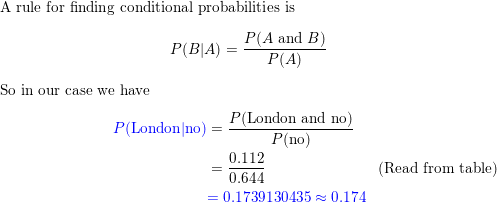
Question 17.
PROBLEM SOLVING
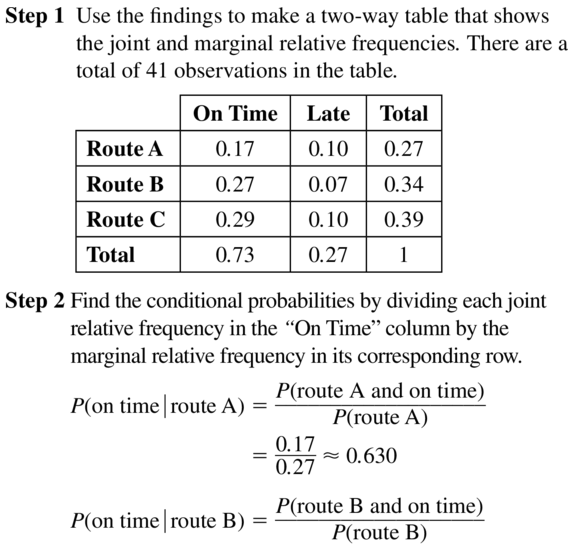
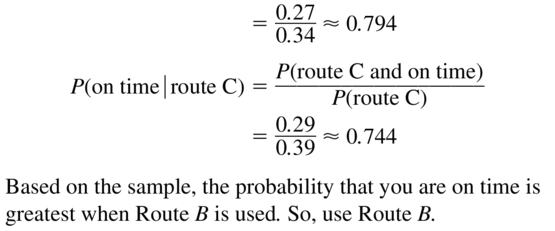
You want to find the quickest route to school. You map out three routes. Before school, you randomly select a route and record whether you are late or on time. The table shows your findings. Assuming you leave at the same time each morning, which route should you use? Explain.
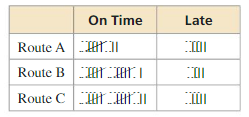
Answer:
Question 18.
PROBLEM SOLVING
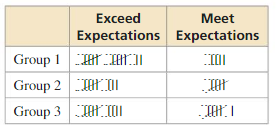
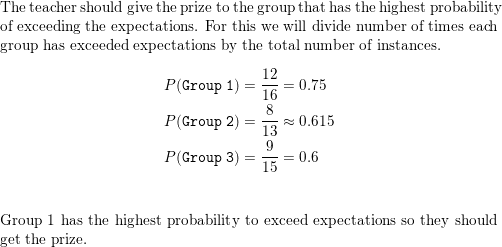
A teacher is assessing three groups of students in order to offer one group a prize. Over a period of time, the teacher records whether the groups meet or exceed expectations on their assigned tasks. The table shows the teacher’s results. Which group should be awarded the prize? Explain.
Answer:
Question 19.
OPEN-ENDED
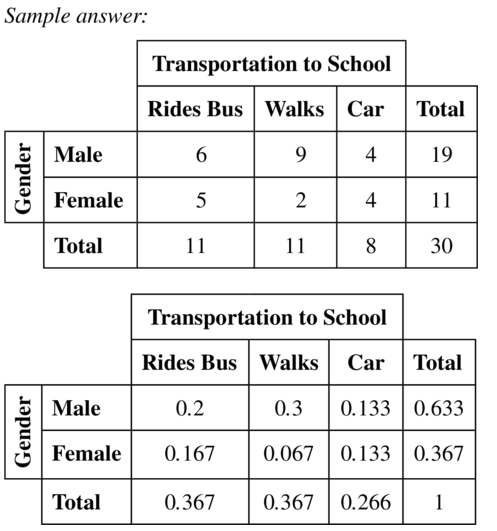
Create and conduct a survey in your class. Organize the results in a two-way table. Then create a two-way table that shows the joint and marginal frequencies.
Answer:
Question 20.
HOW DO YOU SEE IT?
A research group surveys parents and coaches of high school students about whether competitive sports are important in school. The two-way table shows the results of the survey.
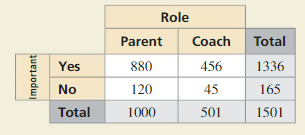
a. What does 120 represent?
b. What does 1336 represent?
c. What does 1501 represent?
Answer:

Question 21.
MAKING AN ARGUMENT
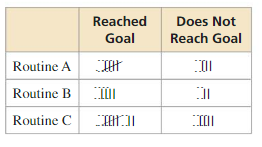
Your friend uses the table below to determine which workout routine is the best. Your friend decides that Routine B is the best option because it has the fewest tally marks in the “Does Not Reach Goal” column. Is your friend correct? Explain your reasoning.
Answer:

Question 22.
MODELING WITH MATHEMATICS
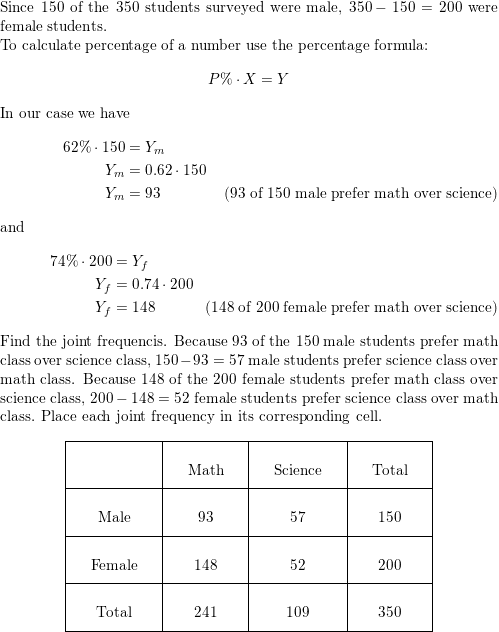
A survey asks students whether they prefer math class or science class. Of the 150 male students surveyed, 62% prefer math class over science class. Of the female students surveyed,74% prefer math. Construct a two-way table to show the number of students in each category if 350 students were surveyed.
Answer:
Question 23.
MULTIPLE REPRESENTATIONS
Use the Venn diagram to construct a two-way table. Then use your table to answer the questions.
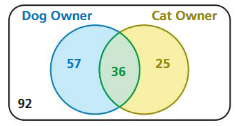
a.What is the probability that a randomly selected person does not own either pet?
b. What is the probability that a randomly selected person who owns a dog also owns a cat?
Answer:
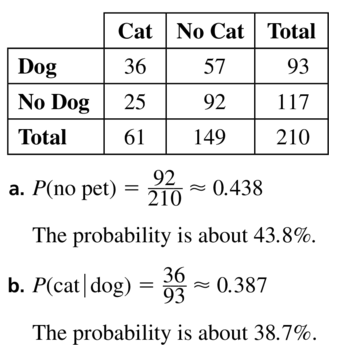
Question 24.
WRITING
Compare two-way tables and Venn diagrams. Then describe the advantages and disadvantages of each.
Answer:
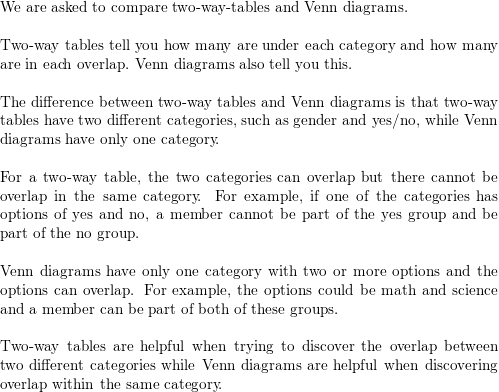
Question 25.
PROBLEM SOLVING
A company creates a new snack, N,and tests it against its current leader, L. The table shows the results.

The company is deciding whether it should try to improve the snack before marketing it, and to whom the snack should be marketed. Use probability to explain the decisions the company should make when the total size of the snack’s market is expected to (a) change very little, and (b) expand very rapidly.
Answer:

Question 26.
THOUGHT PROVOKING
Bayes’ Theorem is given by
P(A|B) = \(\frac{P(B \mid A) \cdot P(A)}{P(B)}\).
Use a two-way table to write an example of Bayes’ Theorem.
Answer:
Answer:
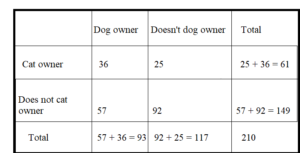
P(Cat owner) = 61/210 = 0.29
P(Dog owner) = 93/210 = 0.442
P(Cat Owner/Dog owner) = P(Dog owner and cat owner)/P(Dog owner) = 0.387
P(Dog owner/Cat owner) = P(Cat owner/Dog owner)P(Dog owner)/P(Cat owner)
= 0.387 × 0.442/0.29
= 0.5898
Maintaining Mathematical Proficiency
Draw a Venn diagram of the sets described.
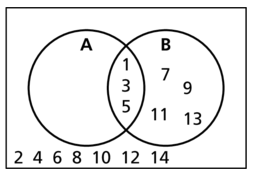
Question 27.
Of the positive integers less than 15, set A consists of the factors of 15 and set B consists of all odd numbers.
Answer:
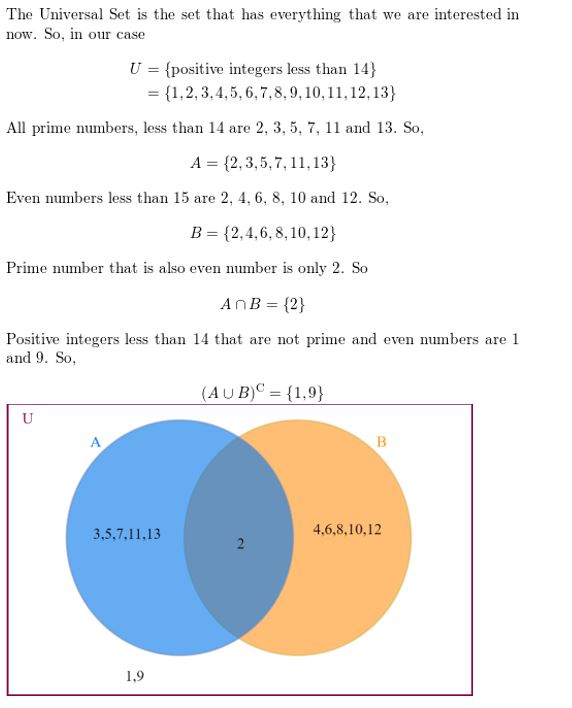
Question 28.
Of the positive integers less than 14, set A consists of all prime numbers and set B consists of all even numbers.
Answer:
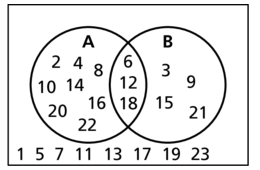
Question 29.
Of the positive integers less than 24, set A consists of the multiples of 2 and set B consists of all the multiples of 3.
Answer:
Probability Study Skills: Making a Mental Cheat Sheet
10.1–10.3 What Did You Learn?
Core Vocabulary

Core Concepts
Section 10.1
Theoretical Probabilities, p. 538
Probability of the Complement of an Event, p. 539
Experimental Probabilities, p. 541
Section 10.2
Probability of Independent Events, p. 546
Probability of Dependent Events, p. 547
Finding Conditional Probabilities, p. 549
Section 10.3
Making Two-Way Tables, p. 554
Relative and Conditional Relative Frequencies, p. 555
Mathematical Practices
Question 1.
How can you use a number line to analyze the error in Exercise 12 on page 542?
Answer:
Question 2.
Explain how you used probability to correct the flawed logic of your friend in Exercise 21 on page 560.
Answer:
Study Skills: Making a Mental Cheat Sheet
- Write down important information on note cards.
- Memorize the information on the note cards, placing the ones containing information you know in one stack and the ones containing information you do not know in another stack. Keep working on the information you do not know.

Probability 10.1–10.3 Quiz
Question 1.
You randomly draw a marble out of a bag containing 8 green marbles, 4 blue marbles, 12 yellow marbles, and 10 red marbles. Find the probability of drawing a marble that is not yellow.
Answer:
Given,
You randomly draw a marble out of a bag containing 8 green marbles, 4 blue marbles 12 yellow marbles, and 10 red marbles.
Total number of outcomes here are 8 + 4 + 12 + 10 = 34
Thus the probability of obtaining a marble that is not yellow is (8 + 4 + 10)/34
= 22/34
= 11/17
= 0.647
= 64.7%
Thus the probability of obtaining a marble that is not yellow is 64.7%
Find P(\(\bar{A}\)).
Question 2.
P(A) = 0.32
Answer:
P(\(\)(\bar{A}) = 1 – P(A)
1 – 0.32
= 0.68
P(\(\)(\bar{A}) = 0.68
Question 3.
P(A) = \(\frac{8}{9}\)
Answer:
P(\(\)(\bar{A}) = 1 – P(A)
1 – \(\frac{8}{9}\)
= \(\frac{1}{9}\)
P(\(\)(\bar{A}) = \(\frac{1}{9}\)
Question 4.
P(A) = 0.01
Answer:
P(\(\)(\bar{A}) = 1 – P(A)
1 – 0.01 = 0.99
Question 5.
You roll a six-sided die 30 times. A 5 is rolled 8 times. What is the theoretical probability of rolling a 5? What is the experimental probability of rolling a 5?
Answer:
Given,
You roll a six-sided die 30 times. A 5 is rolled 8 times.
The theoretical probability of rolling a 5 on a number cube is \(\frac{1}{6}\) while the experimental probability of rolling a 5 on a number cube is \(\frac{8}{30}\) = \(\frac{4}{15}\)
Question 6.
Events A and B are independent. Find the missing probability.
P(A) = 0.25
P(B) = _____
P(A and B) = 0.05
Answer:
Given,
P(A) = 0.25
P(A and B) = 0.05
P(A and B) = P(A) × P(B)
P(B) = P(A and B)/P(A)
P(B) = 0.05/0.25 = 0.2
P(B) = 0.2
Question 7.
Events A and B are dependent. Find the missing probability.
P(A) = 0.6
P(B|A) = 0.2
P(A and B) = _____
Answer:
Given,
P(A) = 0.6
P(B/A) = 0.2
P(A and B) = P(A) × P(B/A)
P(A and B) = 0.6 × 0.2
= 0.12
P(A and B) = 0.12
Question 8.
Find the probability that a dart thrown at the circular target shown will hit the given region. Assume the dart is equally likely to hit any point inside the target.
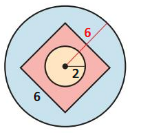
a. the center circle
Answer:
Total area of the given region is π × r² = π × 6² = 36π = 113.112 sq. units
Area of the center circle is π × r² = π × 2² = 4π sq. units.
Therefore the probability of hitting the center circle is 4π/36π = 1/9 = 0.11…
b. outside the square
Answer:
Area of the square is 6² = 36
So the region outside of it is equal to 36π – 36 = 77.112 sq. units
Thus the probability of hitting the region outside the square is 77.112/113.112 = 0.682
c. inside the square but outside the center circle
Answer:
Area of the center circle is π × r² = π × 2² = 4π sq. units.
Area of the square is 6² = 36
Thus the probability of hitting the region outside the center circle but inside the square is 36 – 4π = 23.432 sq. units
Thus the probability of hitting the region is 23.432/113.112 = 0.207
Question 9.
A survey asks 13-year-old and 15-year-old students about their eating habits. Four hundred students are surveyed, 100 male students and 100 female students from each age group. The bar graph shows the number of students who said they eat fruit every day.
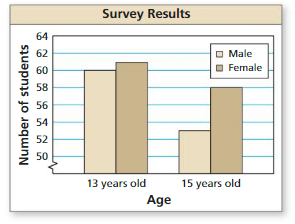
a. Find the probability that a female student, chosen at random from the students surveyed, eats fruit every day.
Answer:
Total number of females who eat a fruit everyday are 61 + 58 = 119
Therefore the probability of randomly choosing a female who eats a fruit everyday is 119/400= 0.2975
b. Find the probability that a 15 – year – old student. chosen at random from the students surveyed, eats fruit every day.
Answer:
Total number of 15 year old student who eat a fruit everyday are 53 + 58 = 111
Therefore the probability of randomly choosing a 15 year old student who eats a fruit everyday is 111/200 = 0.555
Question 10.
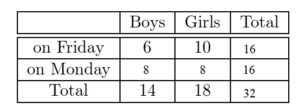
There are 14 boys and 18 girls in a class. The teacher allows the students to vote whether they want to take a test on Friday or on Monday. A total of 6 boys and 10 girls vote to take the test on Friday. Organize the information in a two-way table. Then find and interpret the marginal frequencies.
Answer:
Given,
There are 14 boys and 18 girls in a class. The teacher allows the students to vote whether they want to take a test on Friday or on Monday.
14 + 18 = 32
Number of boys who vote to take the test on Monday is 14 – 6 = 8
Number of girls who vote to take the test on monday is 18 – 10 = 8
A total of 6 boys and 10 girls vote to take the test on Friday.
The total number of students who take the test on Friday is 10 + 6 = 16
The total number of students who vote to take the test on Friday is 8 + 8 = 16
Question 11.
Three schools compete in a cross country invitational. Of the 15 athletes on your team, 9 achieve their goal times. Of the 20 athletes on the home team, 6 achieve their goal times. On your rival’s team, 8 of the 13 athletes achieve their goal times. Organize the information in a two-way table. Then determine the probability that a randomly selected runner who achieves his or her goal time is from your school.
Answer:
Three schools compete in a cross country invitational. Of the 15 athletes on your team. 9 achieve their goal times.
Number of runners in your team who do not achieve their goal team is 15 – 9 = 6
Number of runners in home team who do not achieve their goal team is 20 – 6 = 14
Number of runners in rival’s team who do not achieve their goal team is 13 – 8 = 5
Total number of runners who achieve their goal team is 9 + 6 + 8 = 23
Total number of runners who do not achieve their goal team is 6 + 14 + 5 = 25
The total number of rubbers who was surveyed is 23 + 25 = 48
P = Your team ans achieve their goal team/P(Archive their goal team)
P = 9/23
P = 0.39
Lesson 10.4 Probability of Disjoint and Overlapping Events
Essential Question How can you find probabilities of disjoint and overlapping events?
Two events are disjoint, or mutually exclusive, when they have no outcomes in common. Two events are overlapping when they have one or more outcomes in common.
EXPLORATION 1
Disjoint Events and Overlapping Events
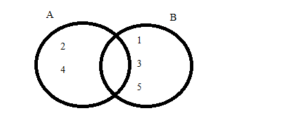
Work with a partner. A six-sided die is rolled. Draw a Venn diagram that relates the two events. Then decide whether the events are disjoint or overlapping.
a. Event A: The result is an even number.
Event B: The result is a prime number.
Answer:
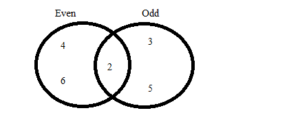
b. Event A: The result is 2 or 4.
Event B: The result is an odd number
Answer:
EXPLORATION 2
Finding the Probability that Two Events Occur
Work with a partner. A six-sided die is rolled. For each pair of events, find (a) P(A), (b) P(B), (c) P(A and B), and (d) P(A or B).
a. Event A: The result is an even number.
Event B: The result is a prime number.
Answer:
P(A) = \(\frac{3}{6}\) = \(\frac{1}{2}\)
P(B) = \(\frac{3}{6}\) = \(\frac{1}{2}\)
P(A or B) = P(A) + P(B) – P(A and B)
P(A and B) = \(\frac{1}{6}\)
P(A or B) = \(\frac{5}{6}\)
b. Event A: The result is 2 or 4.
Event B: The result is an odd number.
Answer:
P(A) = \(\frac{2}{6}\) = \(\frac{1}{3}\)
P(B) = \(\frac{3}{6}\) = \(\frac{1}{2}\)
P(A or B) = P(A) + P(B) – P(A and B)
P(A and B) = 0
P(A or B) = \(\frac{5}{6}\)
EXPLORATION 3
Discovering Probability Formulas
Work with a partner.
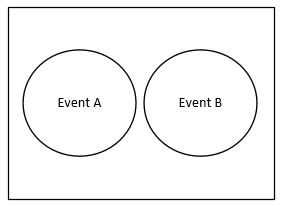
a. In general, if event A and event B are disjoint, then what is the probability that event A or event B will occur? Use a Venn diagram to justify your conclusion.
Answer:
If event A and B are disjoint, there are no common outcomes.
So we add the probabilities that each event occurs:
P(A or B) = P(A) + P(B)
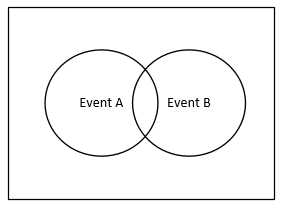
b. In general, if event A and event B are overlapping, then what is the probability that event A or event B will occur? Use a Venn diagram to justify your conclusion.
Answer:
If event A and event B are overlapping, there are common outcomes.
So, we add the probabilities that each event occurs then subtract the probability of the common outcomes.
P(A or B) = P(A) + P(B) – P(A and B)
c. Conduct an experiment using a six-sided die. Roll the die 50 times and record the results. Then use the results to find the probabilities described in Exploration 2. How closely do your experimental probabilities compare to the theoretical probabilities you found in Exploration 2?
Answer:
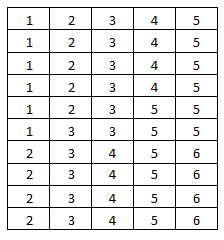
a. P(A) = \(\frac{1}{2}\) = 50%
P(A) = \(\frac{21}{50}\) = 42%
P(B) = \(\frac{1}{2}\) = 50%
P(B) = \(\frac{32}{50}\) = 64%
P(A and B) = \(\frac{1}{6}\) ≈ 16.7%
P(A and B) = \(\frac{9}{50}\) ≈ 18%
P(A or B) = \(\frac{5}{6}\) ≈ 83.3%
P(A or B) = \(\frac{44}{50}\) ≈ 88%
P(A) = \(\frac{1}{3}\) ≈ 33.3%
P(A) = \(\frac{17}{50}\) = 34%
P(B) = \(\frac{1}{2}\) = 50%
P(B) = \(\frac{29}{50}\) = 58%
P(A and B) = 0 = 0%
P(A and B) = \(\frac{0}{50}\) = 0%
P(A or B) = \(\frac{5}{6}\) ≈ 83.3%
P(A or B) = \(\frac{46}{50}\) = 92%
Communicate Your Answer
Question 4.
How can you find probabilities of disjoint and overlapping events?
Answer:
If A and B are disjoint events, then the probability of A or B is P(A or B) = P(A) + P(B). If two events A and B are overlapping, then the outcomes in the intersection of A and B are counted twice when P(A) and P(B) are added.
P(A or B) = P(A) + P(B) – P(A and B)
Question 5.
Give examples of disjoint events and overlapping events that do not involve dice.
Answer:
a. Event A: The result is an even number.
Event B: The result is a prime number.
Answer:

b. Event A: The result is 2 or 4.
Event B: The result is an odd number
Answer:

Monitoring Progress
A card is randomly selected from a standard deck of 52 playing cards. Find the probability of the event.
Question 1.
selecting an ace or an 8
Answer:
A: Selecting an ace
B: You select 8
We know that A has 4 outcomes and B also has 4 outcomes.
P(A or B) = P(A) + P(B)
= 4/52 + 4/52
= 8/52
= 2/13 ≈ 0.15
Question 2.
selecting a 10 or a diamond
Answer:
A: Selecting a 10
B: You select diamond
P(A or B) = P(A) + P(B) – P(A and B)
= 4/52 + 13/52 – 1/52
= 16/52
= 4/13
Question 3.
WHAT IF?
In Example 3, suppose 32 seniors are in the band and 64 seniors are in the band or on the honor roll. What is the probability that a randomly selected senior is both in the band and on the honor roll?
Answer:
Number of seniors = 200
Number of seniors in the band = 32
Number of seniors on the honor roll = 51
Number of seniors in the band or the honor roll = 64
Let us consider there are two events
A: Number of seniors in the band
B: Number of seniors in the honor roll
P(A or B) = P(A) + P(B) – P(A and B)
64/200 = 32/200 + 51/200 – P(A and B)
P(A and B) = 19/200
P(A and B) = 0.0095
Question 4.
In Example 4, what is the probability that the diagnosis is incorrect?
Answer:
Percentage of people who have diabetes = 8.3%
The test is 98% accurate for people who have a disease and 95% for people who do not have the disease.
P(X) = P(A)P(\(\bar{B}\)) + P(\(\bar{A}\))P(\(\bar{B}\))
P(X) = (0.083)(0.02) + (0.917)(0.05)
P(X) = 0.04751
So, the probability that the diagnosis is incorrect is 0.04751
Question 5.
A high school basketball team leads at halftime in 60% of the games in a season. The team wins 80% of the time when they have the halftime lead, but only 10% of the time when they do not. What is the probability that the team wins a particular game during the season?
Answer:
Given,
A high school basketball team leads at halftime in 60% of the games in a season. The team wins 80% of the time when the have the halftime lead, but only 10% of the time when the do not.
Let event A be team leads on the halftime and event B be win.
When A occurs, P(B) = 0.8
When A does not occur, P(B) = 0.1
P(B) = P(A and B) + P(\(\bar{A}\) and B)
P(A) . P(B | A) + P(\(\bar{A}\)) . P(B | \(\bar{A}\))
= 0.6 × 0.8 + 0.4 × 0.1
= 0.52
Probability of Disjoint and Overlapping Events 10.4 Exercises
Vocabulary and Core Concept Check
Question 1.
WRITING
Are the events A and \(\bar{A}\) disjoint? Explain. Then give an example of a real-life event and its complement.
Answer:

Question 2.
DIFFERENT WORDS, SAME QUESTION
Which is different? Find “both” answers.

Answer:
The union of events A and B , denoted by AUB, consists of all outcomes that are in A or in B or in both A and B .
so, there are 4+2+3=9 outcomes in the union of A and B.
Outcomes in intersection of A and B =Outcomes shared by both A and B = Outcomes in B also in A =2
Outcomes in union of A nd B =9.
Monitoring Progress and Modeling with Mathematics
In Exercises 3–6, events A and B are disjoint. Find P(A or B).
Question 3.
P(A) = 0.3, P(B) = 0.1
Answer:

Question 4.
P(A) = 0.55, P(B) = 0.2
Answer:
P(A or B)=P(A)+P(B)
=0.55+0.2
=0.75
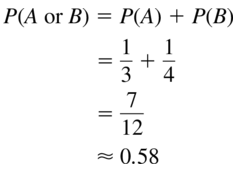
Question 5.
P(A) = \(\frac{1}{3}\), P(B) = \(\frac{1}{4}\)
Answer:
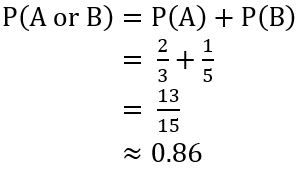
Question 6.
P(A) = \(\frac{2}{3}\), P(B) = \(\frac{1}{5}\)
Answer:
Question 7.
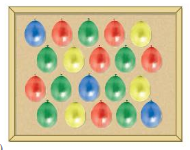
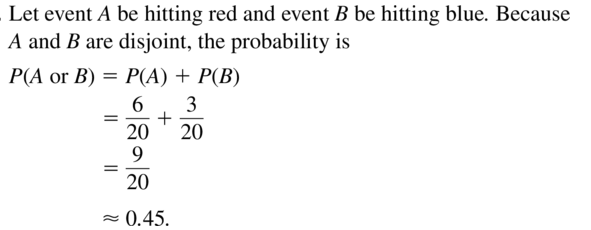
PROBLEM SOLVING
Your dart is equally likely to hit any point inside the board shown. You throw a dart and pop a balloon. What is the probability that the balloon is red or blue?
Answer:
Question 8.
PROBLEM SOLVING
You and your friend are among several candidates running for class president. You estimate that there is a 45% chance you will win and a 25% chance your friend will win. What is the probability that you or your friend win the election?
Answer:
![]()
Question 9.
PROBLEM SOLVING
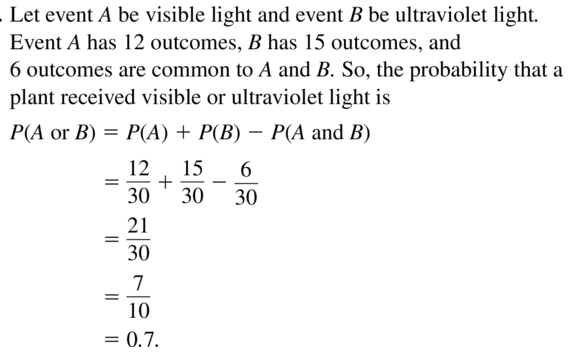
You are performing an experiment to determine how well plants grow under different light sources. Of the 30 plants in the experiment, 12 receive visible light, 15 receive ultraviolet light, and 6 receive both visible and ultraviolet light. What is the probability that a plant in the experiment receives visible or ultraviolet light?
Answer:
Question 10.
PROBLEM SOLVING
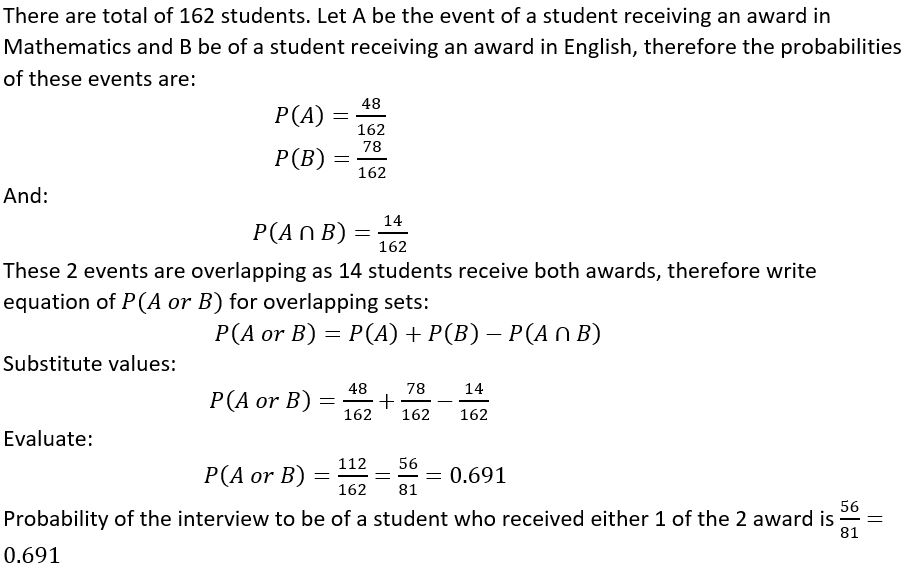
Of 162 students honored at an academic awards banquet, 48 won awards for mathematics and 78 won awards for English. There are 14 students who won awards for both mathematics and English. A newspaper chooses a student at random for an interview. What is the probability that the student interviewed won an award for English or mathematics?
Answer:
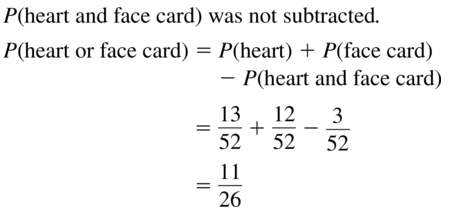
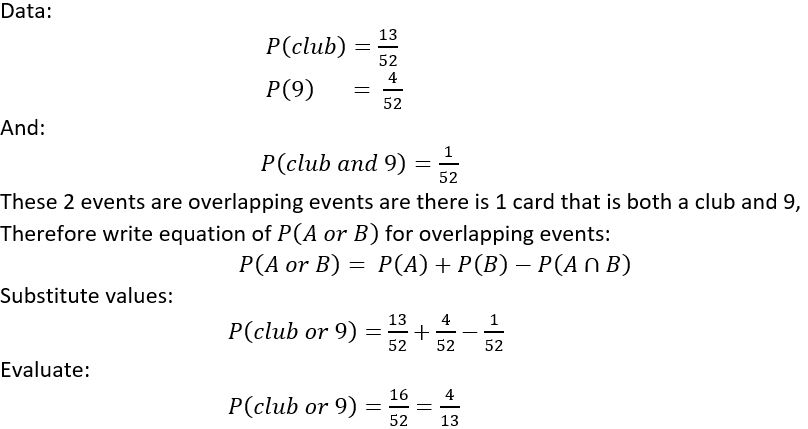
ERROR ANALYSIS In Exercises 11 and 12, describe and correct the error in finding the probability of randomly drawing the given card from a standard deck of 52 playing cards.
Question 11.

Answer:
Question 12.

Answer:
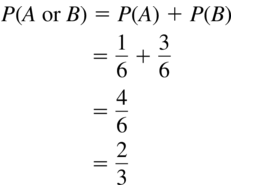
In Exercises 13 and 14, you roll a six-sided die. Find P(A or B).
Question 13.
Event A: Roll a 6.
Event B: Roll a prime number.
Answer:
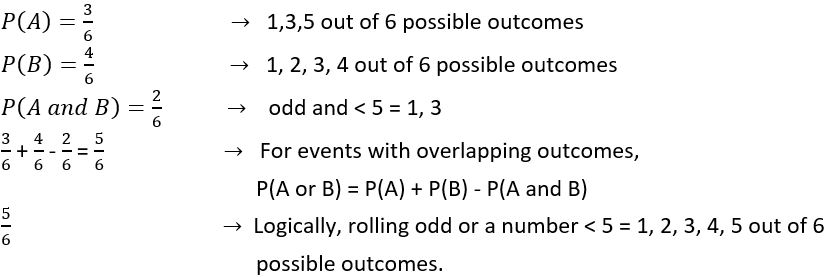
Question 14.
Event A: Roll an odd number.
Event B: Roll a number less than 5.
Answer:
Question 15.
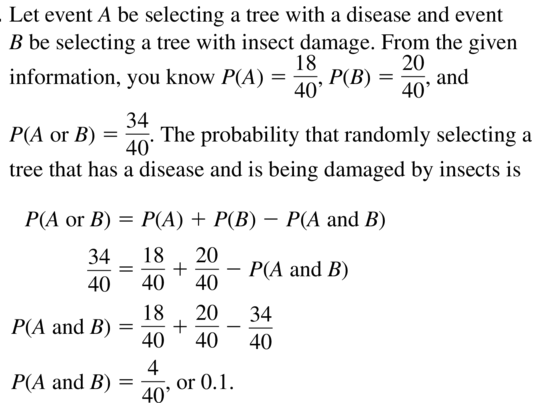
DRAWING CONCLUSIONS
A group of 40 trees in a forest are not growing properly. A botanist determines that 34 of the trees have a disease or are being damaged by insects, with 18 trees having a disease and 20 being damaged by insects. What is the probability that a randomly selected tree has both a disease and is being damaged by insects?

Answer:
Question 16.
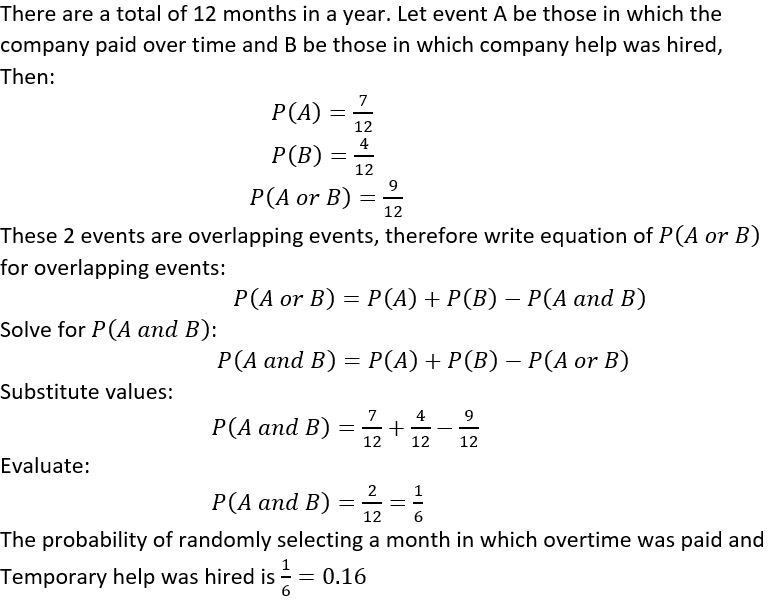
DRAWING CONCLUSIONS
A company paid overtime wages or hired temporary help during 9 months of the year. Overtime wages were paid during 7 months, and temporary help was hired during 4 months. At the end of the year, an auditor examines the accounting records and randomly selects one month to check the payroll. What is the probability that the auditor will select a month in which the company paid overtime wages and hired temporary help?
Answer:
Question 17.
DRAWING CONCLUSIONS
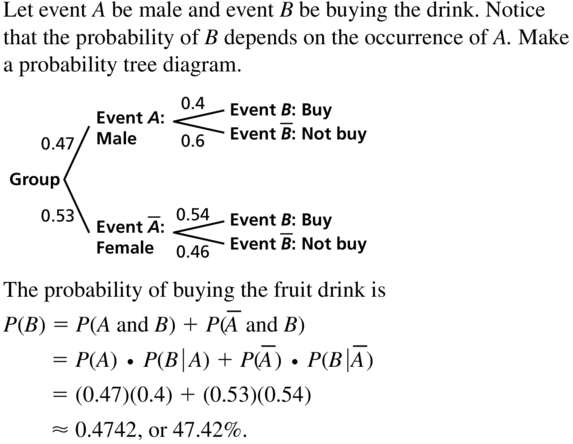
A company is focus testing a new type of fruit drink. The focus group is 47% male. Of the responses, 40% of the males and 54% of the females said they would buy the fruit drink. What is the probability that a randomly selected person would buy the fruit drink?
Answer:
Question 18.
DRAWING CONCLUSIONS
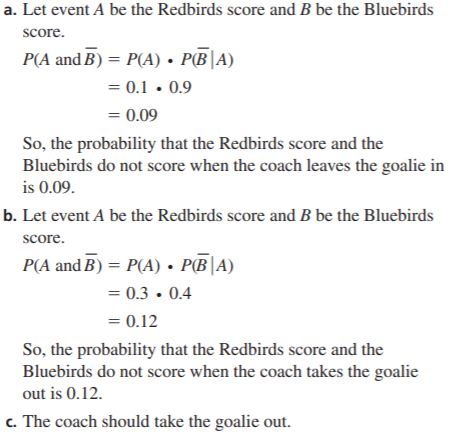
The Redbirds trail the Bluebirds by one goal with 1 minute left in the hockey game. The Redbirds’ coach must decide whether to remove the goalie and add a frontline player. The probabilities of each team scoring are shown in the table.

a. Find the probability that the Redbirds score and the Bluebirds do not score when the coach leaves the goalie in.
b. Find the probability that the Redbirds score and the Bluebirds do not score when the coach takes the goalie out.
c. Based on parts (a) and (b), what should the coach do?
Answer:
Question 19.
PROBLEM SOLVING
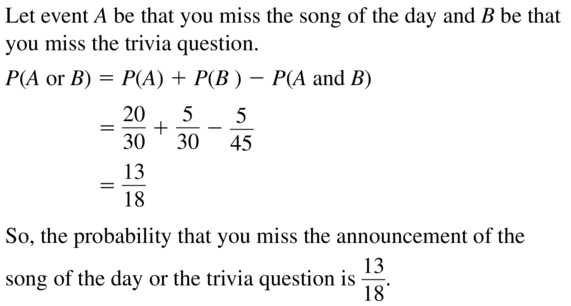
You can win concert tickets from a radio station if you are the first person to call when the song of the day is played, or if you are the first person to correctly answer the trivia question. The song of the day is announced at a random time between 7:00 and 7:30 A.M. The trivia question is asked at a random time between 7:15 and 7:45 A.M. You begin listening to the radio station at 7:20. Find the probability that you miss the announcement of the song of the day or the trivia question.
Answer:
Question 20.
HOW DO YOU SEE IT?
Are events A and B disjoint events? Explain your reasoning.
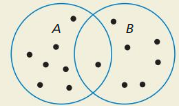
Answer: No; The intersection of A and B is not empty.
Question 21.
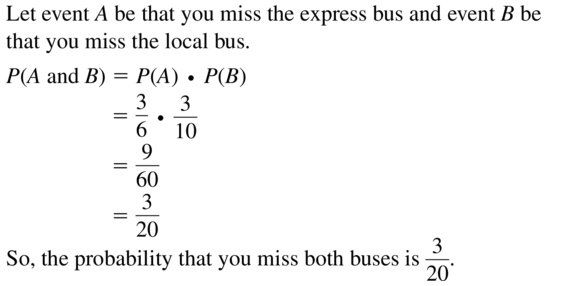
PROBLEM SOLVING
You take a bus from your neighborhood to your school. The express bus arrives at your neighborhood at a random time between 7:30 and 7:36 A.M. The local bus arrives at your neighborhood at a random time between 7:30 and 7:40 A.M. You arrive at the bus stop at 7:33 A.M. Find the probability that you missed both the express bus and the local bus.

Answer:
Question 22.
THOUGHT PROVOKING
Write a general rule for finding P(A or B or C) for (a) disjoint and (b) overlapping events A, B, and C.
Answer:

Question 23.
MAKING AN ARGUMENT
A bag contains 40 cards numbered 1 through 40 that are either red or blue. A card is drawn at random and placed back in the bag. This is done four times. Two red cards are drawn, numbered 31 and 19, and two blue cards are drawn, numbered 22 and 7. Your friend concludes that red cards and even numbers must be mutually exclusive. Is your friend correct? Explain.
Answer:

Maintaining Mathematical Proficiency
Write the first six terms of the sequence.
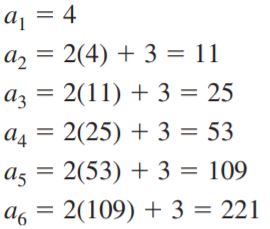
Question 24.
a1 = 4, an = 2an-1 + 3
Answer:
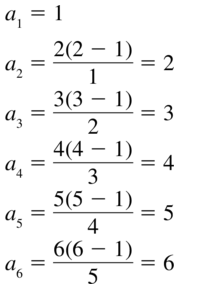
Question 25.
a1 = 1, an = \(\frac{n(n-1)}{a_{n-1}}\)
Answer:
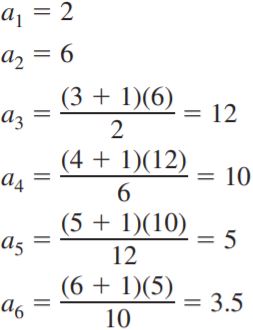
Question 26.
a1 = 2, a2 = 6, an = \(\frac{(n+1) a_{n-1}}{a_{n-2}}\)
Answer:
Lesson 10.5 Permutations and Combinations
Essential Question How can a tree diagram help you visualize the number of ways in which two or more events can occur?
EXPLORATION 1
Reading a Tree Diagram
Work with a partner. Two coins are flipped and the spinner is spun. The tree diagram shows the possible outcomes.
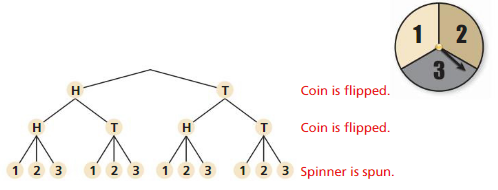
a. How many outcomes are possible?
Answer:
There are 4 possible outcomes when two coins are flipped.
There are three possible outcomes for the spinner.
Therefore the possible number of outcomes are,
4 × 3 = 12
b. List the possible outcomes.
Answer:
The possible outcomes when two coins are flipped are HH, HT, TH, TT.
Since the numbers on the spinner are 1, 2 and 3.
Therefore the possible outcomes when the spinner is spun are 1, 2, 3.
The possible outcomes are
(H, H, 1), (H, H, 2), (H, H, 3)
(H, T, 1), (H, T, 2), (H, T, 3)
(T, H, 1), (T, H, 2), (T, H, 3)
(T, T, 1), (T, T, 2), (T, T, 3)
EXPLORATION 2
Reading a Tree Diagram
Work with a partner. Consider the tree diagram below.

a. How many events are shown?
Answer:
In the given tree diagram, there is an initial event having two branches and its each branch is followed by the second event having three branches.
Further, each of the three branches of the second event are followed by the third event having two branches.
Lastly, these two branches are followed by a fourth event having two branches.
Thus there are total of four branches in a given tree diagram.
b. What outcomes are possible for each event?
Answer:
We know that the number of nodes at the end of the branch(s) representing an event in a tree diagram gives the number of its possible outcomes.
Number of possible outcomes of a first event =2
Number of possible outcomes of a second event =3
Number of possible outcomes of a third event =2
Number of possible outcomes of a fourth event =2
Thus the number of possible outcomes in first, second, third and fourth event are 2, 3, 2 and 2.
c. How many outcomes are possible?
Answer:
The number of nodes at the end of the tree diagram gives the number of its possible outcomes
Number of final nodes = Number of possible outcomes
Number of possible outcomes =24
d. List the possible outcomes.
Answer:
There are four events.
The first event has 2 outcomes which are A and B.
The second event has 3 outcomes which are1,2 and3.
The third event has 2 outcomes which are X and Y.
The fourth event has 2 outcomes which are A and B.The number of possible outcomes =24
All the possible outcomes are given by {A1, XA, A1XB, A1YA, A1YB, A2XA, A2XB, A2YA, A2YB, A3XA, A3XB, A3YA, A3YB, B1XA, B1XB, B1YB, B1YB, B2XA, B2XB, B2YA, B2YB, B3XA, B3XB, B3YA, B3YB}
EXPLORATION 3
Writing a Conjecture
Work with a partner.
a. Consider the following general problem: Event 1 can occur in m ways and event 2 can occur in n ways. Write a conjecture about the number of ways the two events can occur. Explain your reasoning.
b. Use the conjecture you wrote in part (a) to write a conjecture about the number of ways more than two events can occur. Explain your reasoning.
c. Use the results of Explorations 1(a) and 2(c) to verify your conjectures.
Communicate Your Answer
Question 4.
How can a tree diagram help you visualize the number of ways in which two or more events can occur?
Answer:
Question 5.
In Exploration 1, the spinner is spun a second time. How many outcomes are possible?
Answer:
Monitoring Progress
Question 1.
In how many ways can you arrange the letters in the word HOUSE?
Answer:
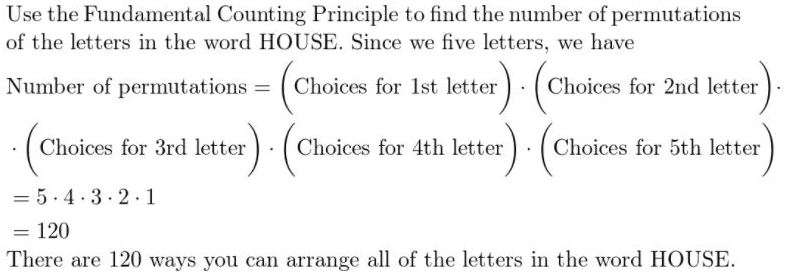
Question 2.
In how many ways can you arrange 3 of the letters in the word MARCH?
Answer:
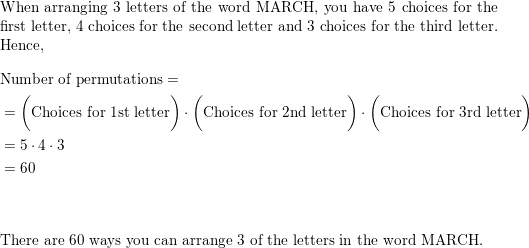
Question 3.
WHAT IF?
In Example 2, suppose there are 8 horses in the race. In how many different ways can the horses finish first, second, and third? (Assume there are no ties.)
Answer:
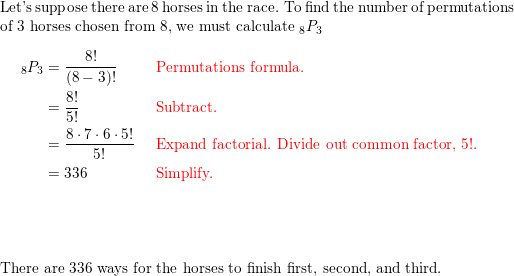
Question 4.
WHAT IF?
In Example 3, suppose there are 14 floats in the parade. Find the probability that the soccer team is first and the chorus is second.
Answer:
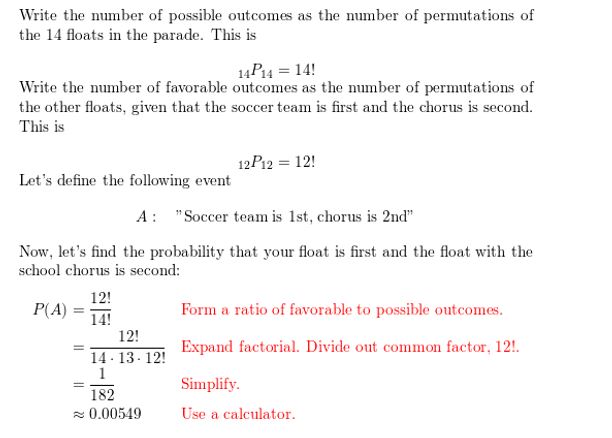
Question 5.
Count the possible combinations of 3 letters chosen from the list A, B, C, D, E.
Answer:
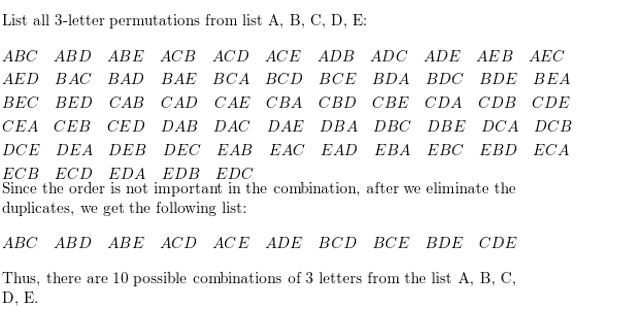
Question 6.
WHAT IF?
In Example 5, suppose you can choose 3 side dishes out of the list of 8 side dishes. How many combinations are possible?
Answer:
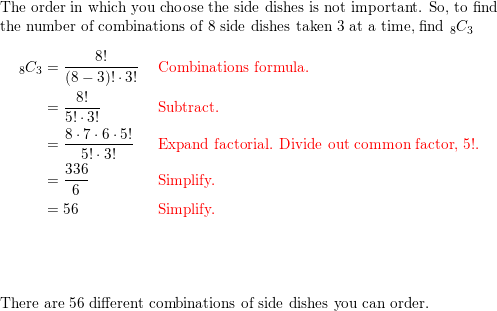
Question 7.
WHAT IF?
In Example 6, suppose there are 20 photos in the collage. Find the probability that your photo and your friend’s photo are the 2 placed at the top of the page.
Answer:
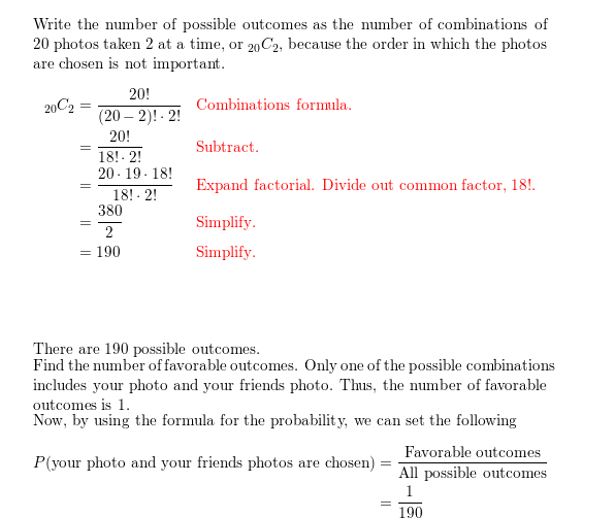
Question 8.
Use the Binomial Theorem to write the expansion of (a) (x + 3)5 and (b) (2p − q)4.
Answer:
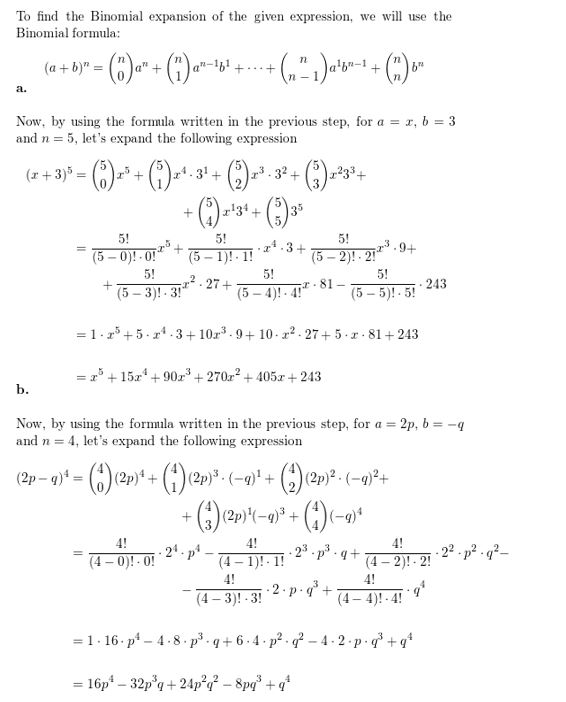
Question 9.
Find the coefficient of x5 in the expansion of (x − 3)7.
Answer:
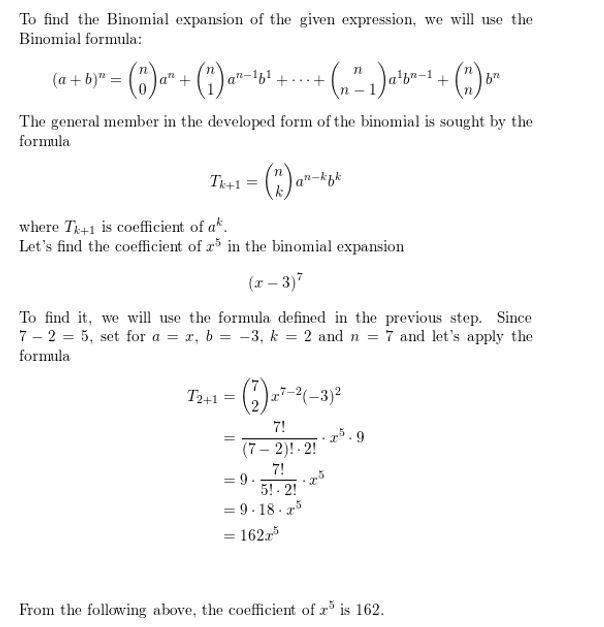
Question 10.
Find the coefficient of x3 in the expansion of (2x + 5)8.
Answer:
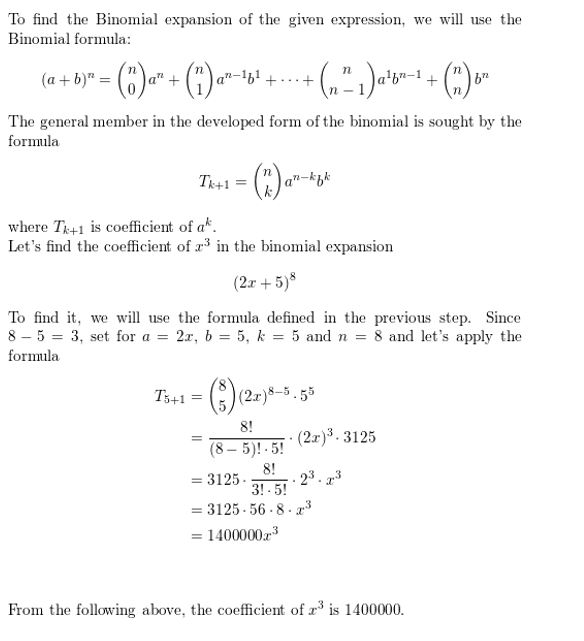
Permutations and Combinations 10.5 Exercises
Vocabulary and Core Concept Check
Question 1.
COMPLETE THE SENTENCE
An arrangement of objects in which order is important is called a(n) __________.
Answer:

Question 2.
WHICH ONE DOESN’T BELONG?
Which expression does not belong with the other three? Explain your reasoning.

Answer:
7!/2!.5
This option is the only one that is not a form of a combination
Monitoring Progress and Modeling with Mathematics
In Exercises 3–8, find the number of ways you can arrange (a) all of the letters and (b) 2 of the letters in the given word.
Question 3.
AT
Answer:
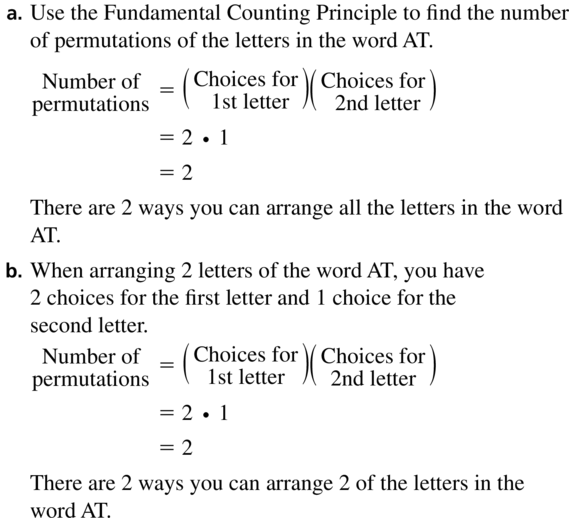
Question 4.
TRY
Answer:
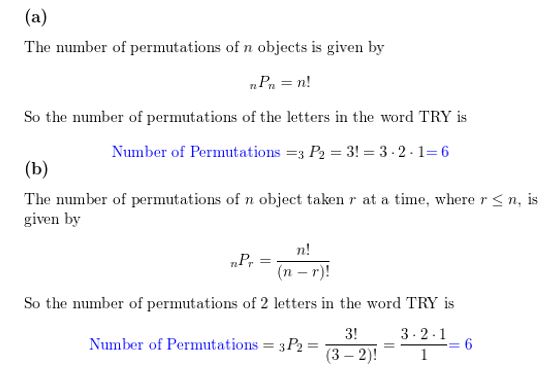
Question 5.
ROCK
Answer:
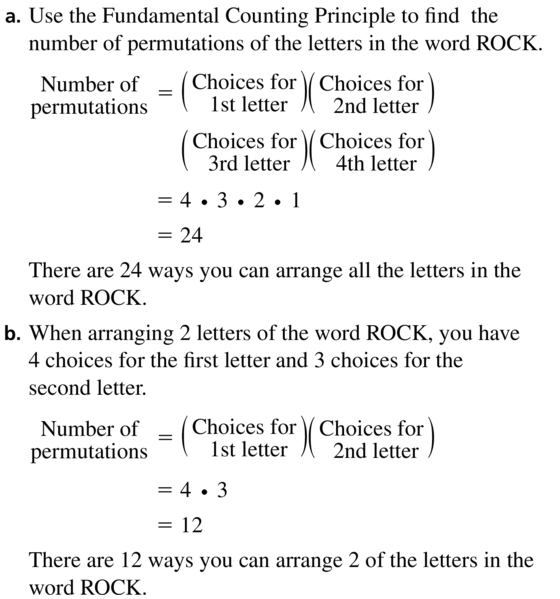
Question 6.
WATER
Answer:
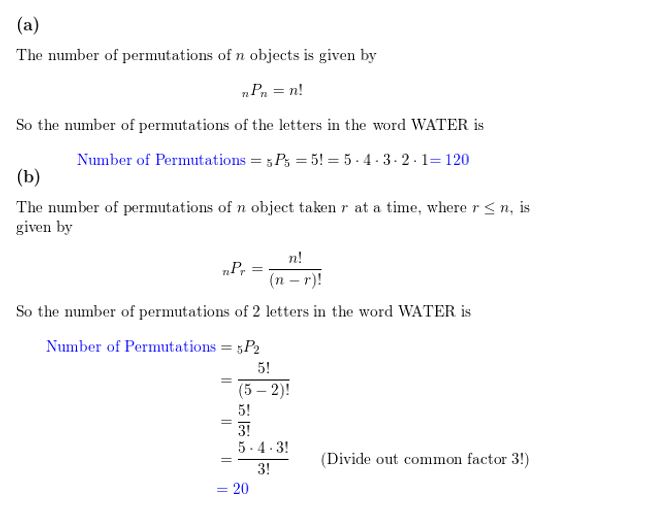
Question 7.
FAMILY
Answer:
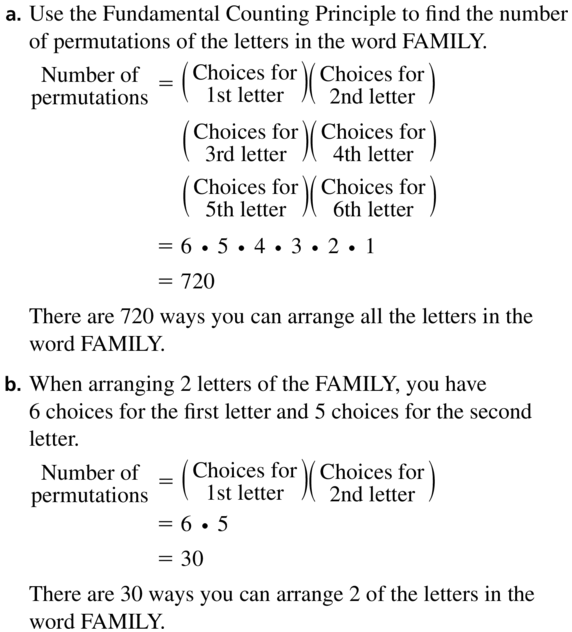
Question 8.
FLOWERS
Answer:
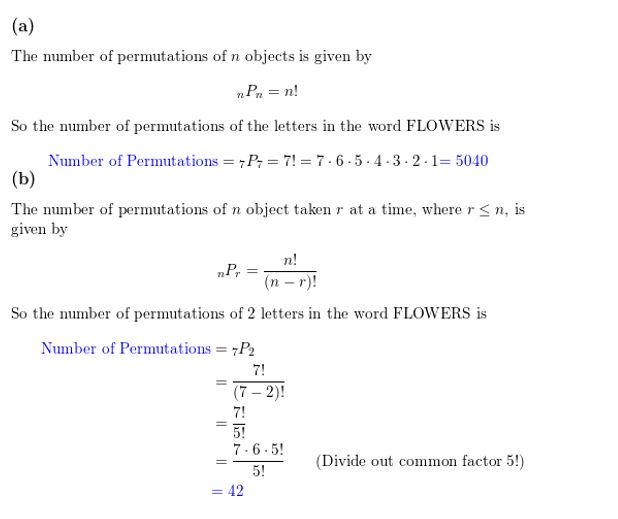
In Exercises 9–16, evaluate the expression.
Question 9.
5P2
Answer:
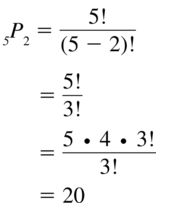
Question 10.
7P3
Answer:
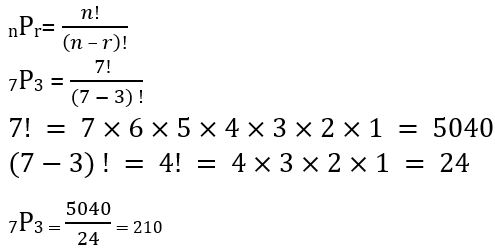
Question 11.
9P1
Answer:
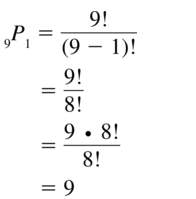
Question 12.
6P5
Answer:
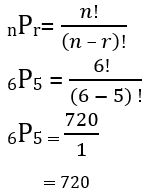
Question 13.
8P6
Answer:
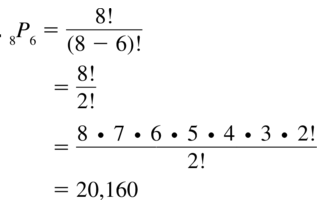
Question 14.
12P0
Answer:
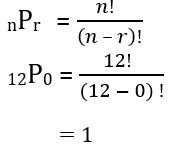
Question 15.
30P2
Answer:
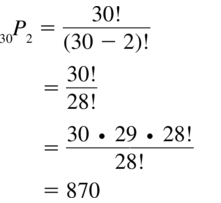
Question 16.
25P5
Answer:
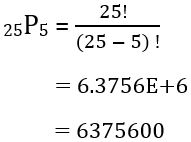
Question 17.
PROBLEM SOLVING
Eleven students are competing in an art contest. In how many different ways can the students finish first, second, and third?
Answer:
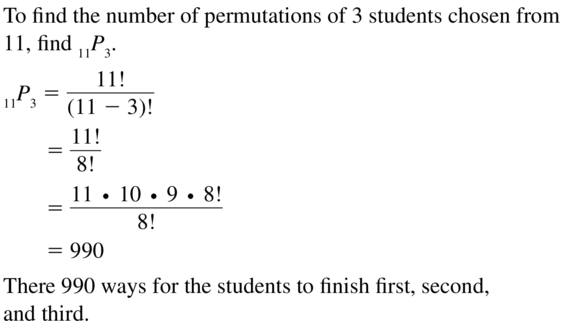
Question 18.
PROBLEM SOLVING
Six friends go to a movie theater. In how many different ways can they sit together in a row of 6 empty seats?

Answer:
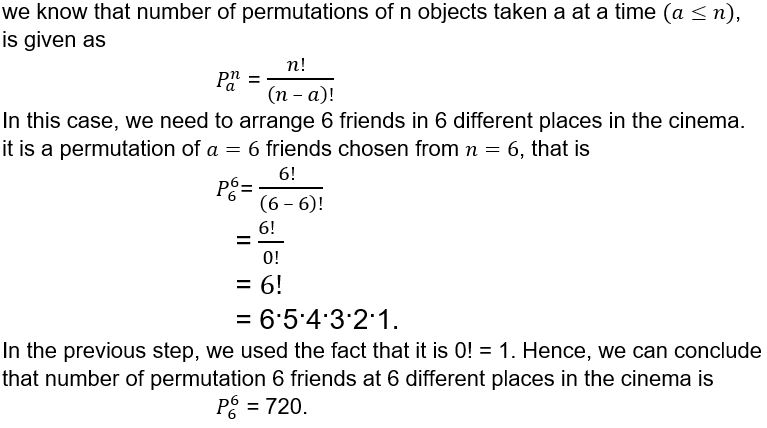
Question 19.
PROBLEM SOLVING
You and your friend are 2 of 8 servers working a shift in a restaurant. At the beginning of the shift, the manager randomly assigns one section to each server. Find the probability that you are assigned Section 1 and your friend is assigned Section 2.
Answer:
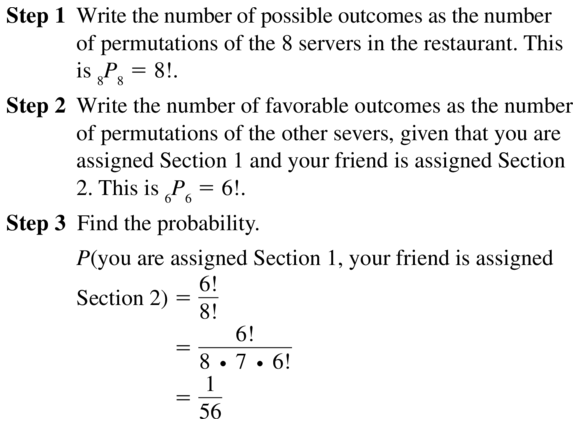
Question 20.
PROBLEM SOLVING
You make 6 posters to hold up at a basketball game. Each poster has a letter of the word TIGERS. You and 5 friends sit next to each other in a row. The posters are distributed at random. Find the probability that TIGERS is spelled correctly when you hold up the posters.

Answer:

In Exercises 21–24, count the possible combinations of r letters chosen from the given list.
Question 21.
A, B, C, D; r = 3
Answer:
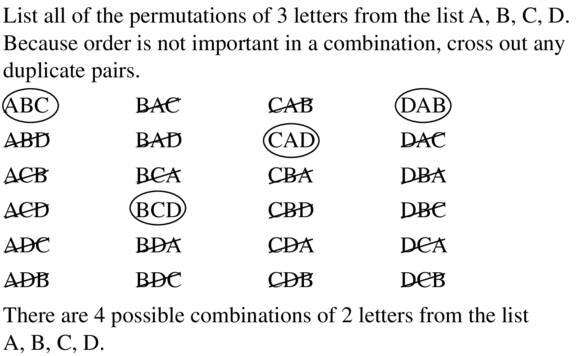
Question 22.
L, M, N, O; r = 2
Answer:
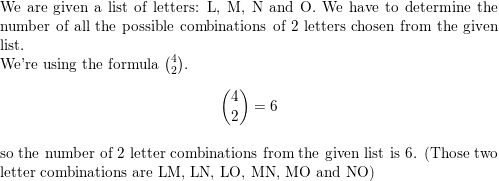
Question 23.
U, V, W, X, Y, Z; r = 3
Answer:
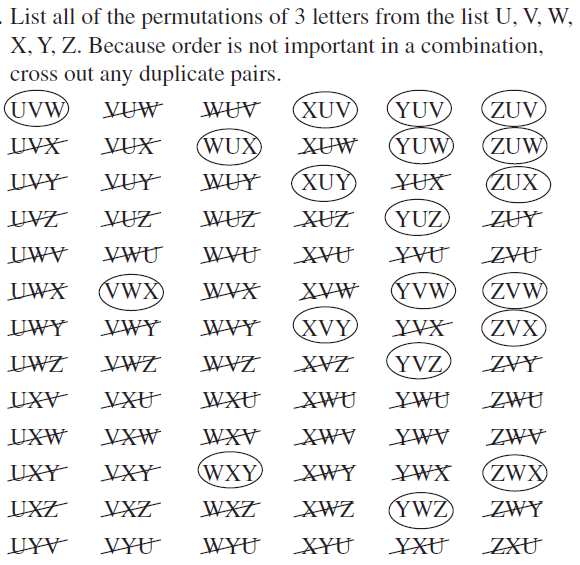
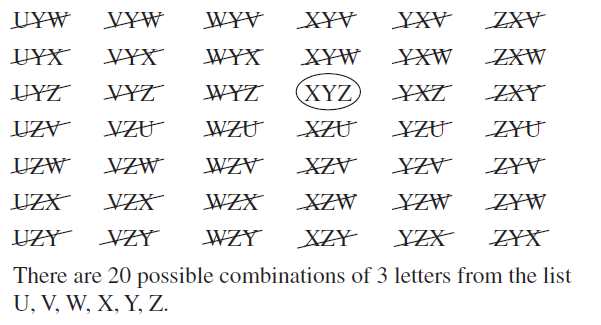
Question 24.
D, E, F, G, H; r = 4
Answer:

In Exercises 25–32, evaluate the expression.
Question 25.
5C1
Answer:
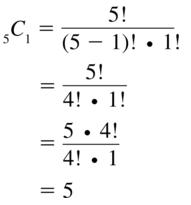
Question 26.
8C5
Answer:
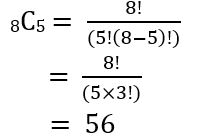
Question 27.
9C9
Answer:
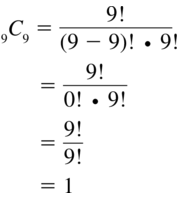
Question 28.
8C6
Answer:
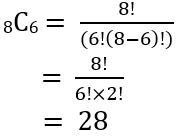
Question 29.
12C3
Answer:
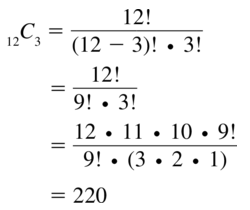
Question 30.
11C4
Answer:
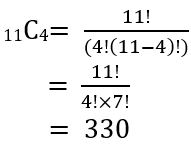
Question 31.
15C8
Answer:
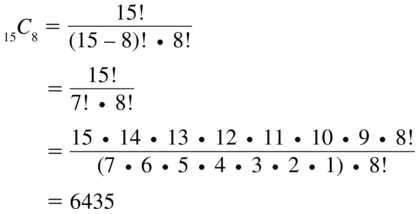
Question 32.
20C5
Answer:
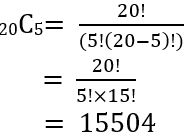
Question 33.
PROBLEM SOLVING
Each year, 64 golfers participate in a golf tournament. The golfers play in groups of 4.How many groups of 4 golfers are possible?
Answer:
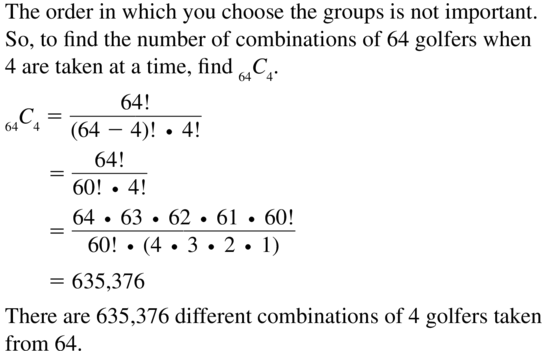
Question 34.
PROBLEM SOLVING
You want to purchase vegetable dip for a party. A grocery store sells 7 different flavors of vegetable dip. You have enough money to purchase 2 flavors. How many combinations of 2 flavors of vegetable dip are possible?
Answer:
given that,
You want to purchase vegetable dip for a party. A grocery store sells 7 different flavors of vegetable dip. You have enough money to purchase 2 flavors.
7C2 = \(\frac{7!}{(7-2) !}\)
= \(\frac{7!}{5!}\) . \(\frac{1}{2!}\)
= 7 . 6 . 5 . 4 . 3 . 2 . 1/(5 . 4 . 3 . 2 . 1) (2 . 1)
= 7 . 3
7C2 = 21
ERROR ANALYSIS In Exercises 35 and 36, describe and correct the error in evaluating the expression.
Question 35.

Answer:

Question 36.

Answer: The permutation formula was used instead of the combination formula.
REASONING In Exercises 37–40, tell whether the question can be answered using permutations or combinations. Explain your reasoning. Then answer the question.
Question 37.
To complete an exam, you must answer 8 questions from a list of 10 questions. In how many ways can you complete the exam?
Answer:

Question 38.
Ten students are auditioning for 3 different roles in aplay. In how many ways can the 3 roles be filled?
Answer:
As 10 students are auditioning for 3 roles, which are different from each other, the order in which the roles are assigned to the students is important and should be taken into account.
As the Permutations formula takes into account the order of distribution. Hence the number of ways to fill the 3 roles can be found by using the permutations formula in the chapter.
So, the number of permutations of assigning the 3 roles to 3 students chosen from 10, using the permutations formula
10P3 = \(\frac{10!}{(10-3) !}\)
= \(\frac{10!}{7!}\)
= 10 . 9 . 8 . 7 . 6 . 5 . 4 . 3 . 2 . 1/(7 . 6 . 5 . 4 . 3 . 2 . 1)
=10 . 9 . 8
10P3 = 720
Question 39.
Fifty-two athletes are competing in a bicycle race. In how many orders can the bicyclists finish first, second, and third? (Assume there are no ties.)
Answer:

Question 40.
An employee at a pet store needs to catch 5 tetras in an aquarium containing 27 tetras. In how many groupings can the employee capture 5 tetras?
Answer:
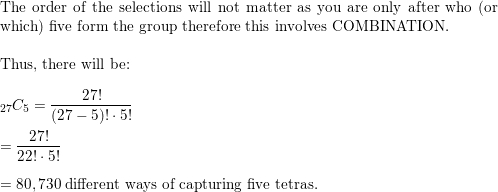
Question 41.
CRITICAL THINKING
Compare the quantities 50C9 and 50C41 without performing any calculations. Explain your reasoning.
Answer:

Question 42.
CRITICAL THINKING
Show that each identity is true for any whole numbers r and n, where 0 ≤ r ≤ n.
a. nCn = 1
b. nCr = nCn-r − r
c. n+1Cr = nCr + nCr-1
Answer:
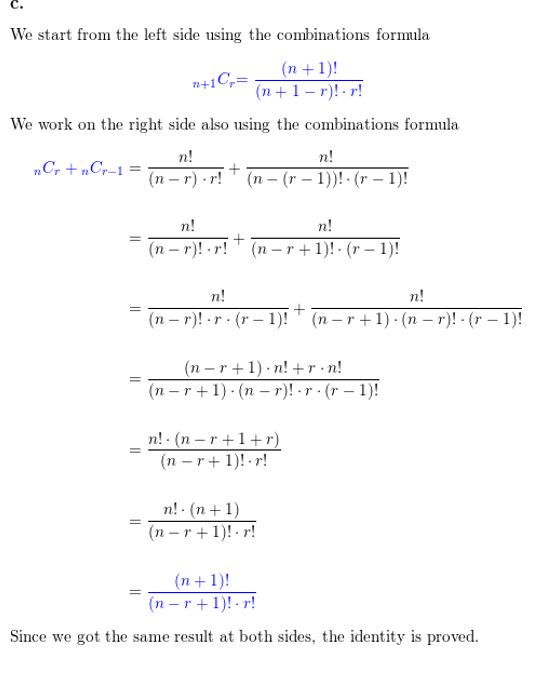
Question 43.
REASONING
Consider a set of 4 objects.
a. Are there more permutations of all 4 of the objects or of 3 of the objects? Explain your reasoning.
b. Are there more combinations of all 4 of the objects or of 3 of the objects? Explain your reasoning.
c. Compare your answers to parts (a) and (b).
Answer:

Question 44.
OPEN-ENDED
Describe a real-life situation where the number of possibilities is given by 5P2. Then describe a real-life situation that can be modeled by 5C2.
Answer:
5P2
The permutation is the one with president and vice president.
5C2
Combination is the one with only choosing 2 out of 5.
Question 45.
REASONING
Complete the table for each given value of r. Then write an inequality relating nPr and nCr. Explain your reasoning.
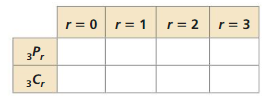
Answer:
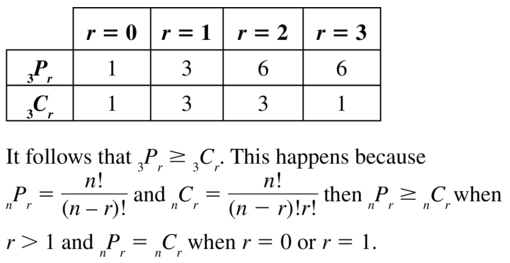
Question 46.
REASONING
Write an equation that relates nPr and nCr. Then use your equation to find and interpret the value of \(\frac{182^{P_{4}}}{182^{C_{4}}}\).
Answer:
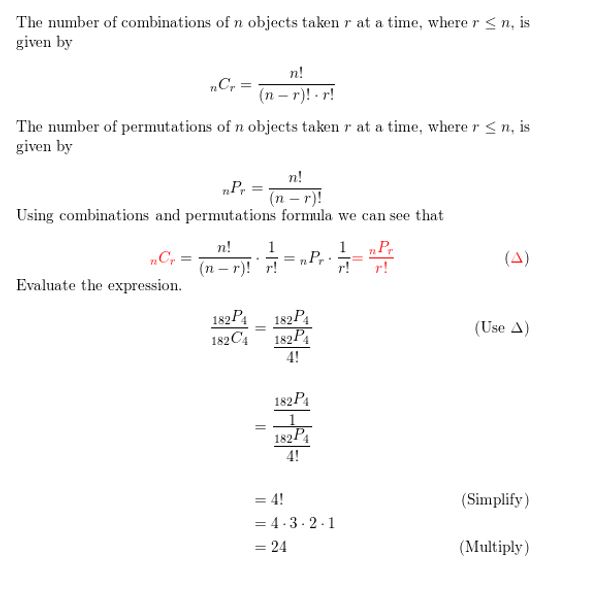
Question 47.
PROBLEM SOLVING
You and your friend are in the studio audience on a television game show. From an audience of 300 people, 2 people are randomly selected as contestants. What is the probability that you and your friend are chosen?
Answer:
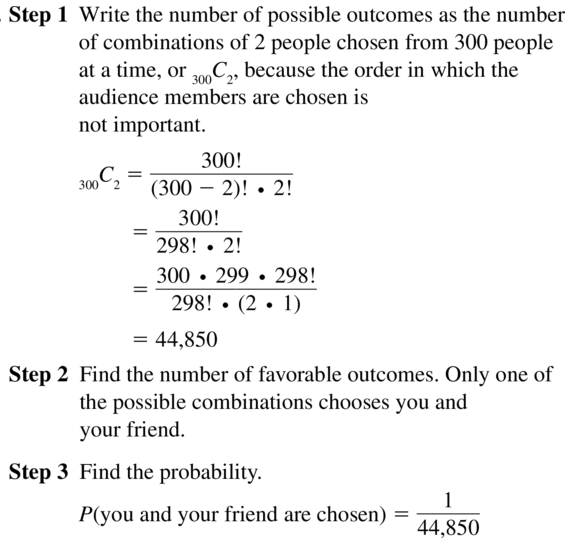
Question 48.
PROBLEM SOLVING
You work 5 evenings each week at a bookstore. Your supervisor assigns you 5 evenings at random from the 7 possibilities. What is the probability that your schedule does not include working on the weekend?
Answer:
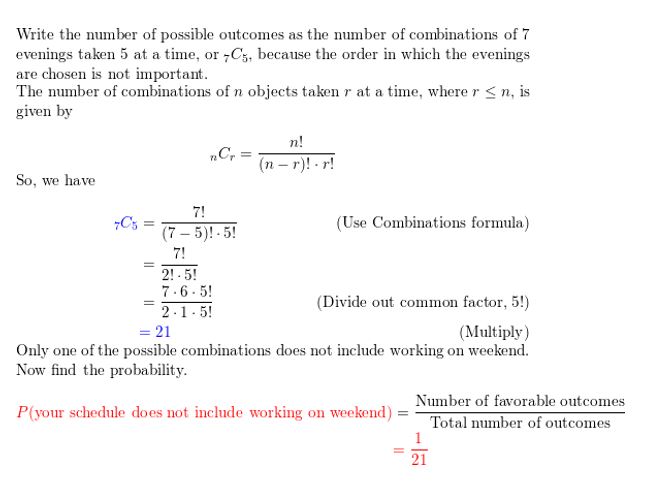
REASONING In Exercises 49 and 50, find the probability of winning a lottery using the given rules. Assume that lottery numbers are selected at random.
Question 49.
You must correctly select 6 numbers, each an integer from 0 to 49. The order is not important.
Answer:
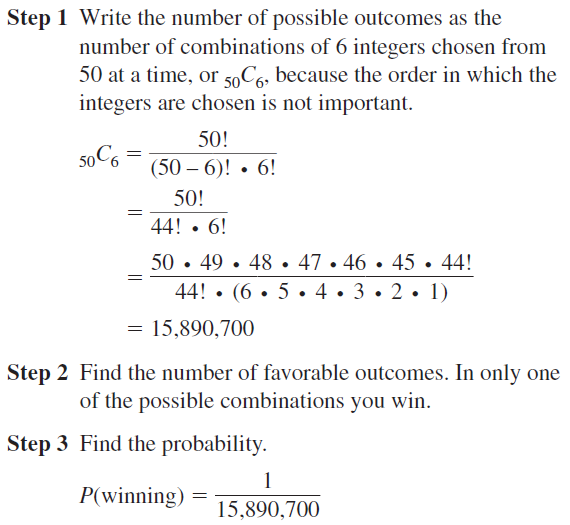
Question 50.
You must correctly select 4 numbers, each an integer from 0 to 9. The order is important.’
Answer:
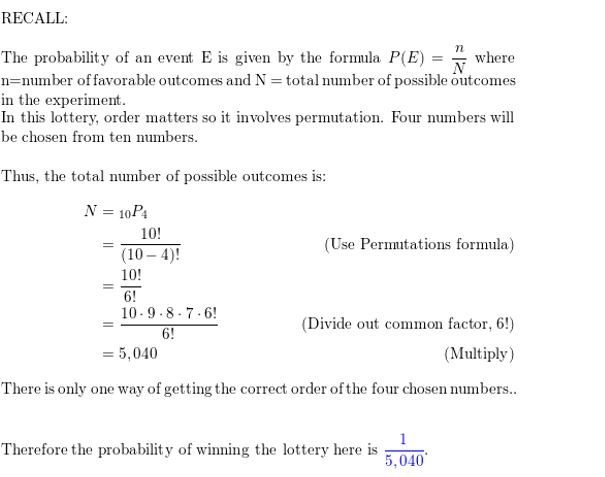
In Exercises 51–58, use the Binomial Theorem to write the binomial expansion.
Question 51.
(x + 2)3
Answer:

Question 52.
(c − 4)5
Answer:
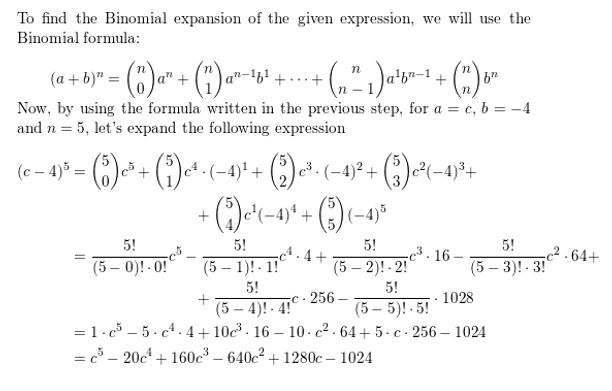
Question 53.
(a + 3b)4
Answer:

Question 54.
(4p − q)6
Answer:
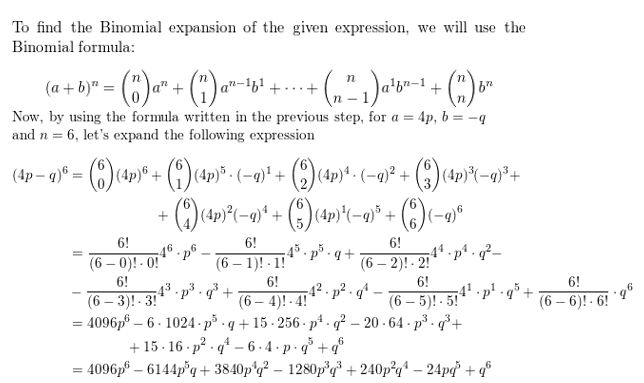
Question 55.
(w3 − 3)4
Answer:
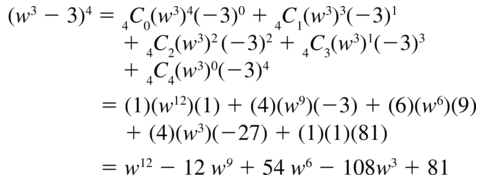
Question 56.
(2s4 + 5)5
Answer:
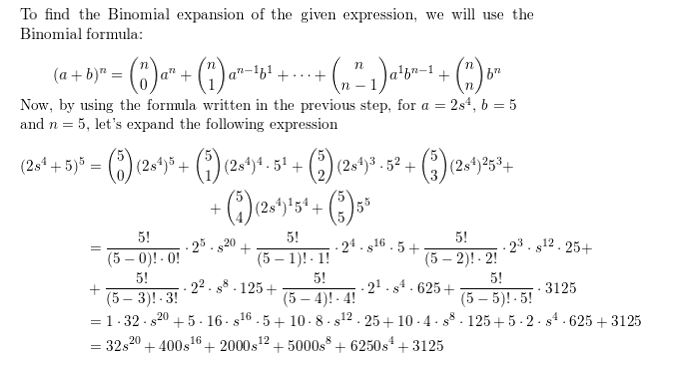
Question 57.
(3u + v2)6
Answer:
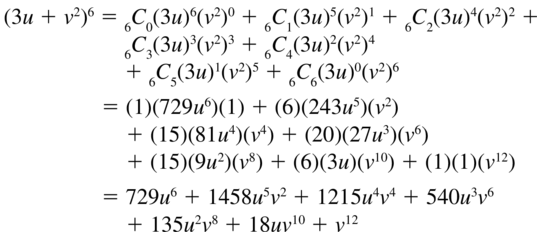
Question 58.
(x3 − y2)4
Answer:
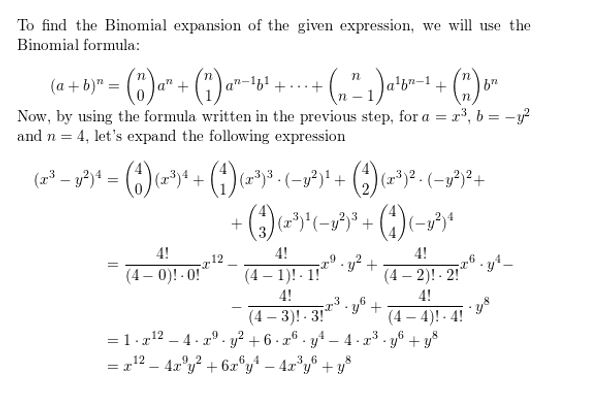
In Exercises 59–66, use the given value of n to find the coefficient of xn in the expansion of the binomial.
Question 59.
(x − 2)10, n = 5
Answer:
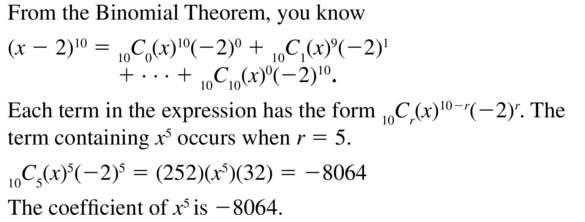
Question 60.
(x − 3)7, n = 4
Answer:
Question 61.
(x2 − 3)8, n = 6
Answer:
Question 62.
(3x + 2)5, n = 3
Answer:
Question 63.
(2x + 5)12, n = 7
Answer:
Question 64.
(3x − 1)9, n = 2
Answer:
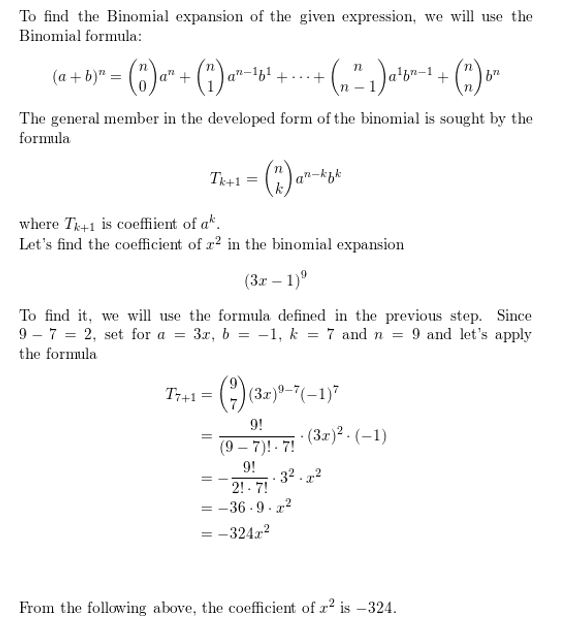
Question 65.
(\(\frac{1}{2}\)x − 4 )11, n = 4
Answer:
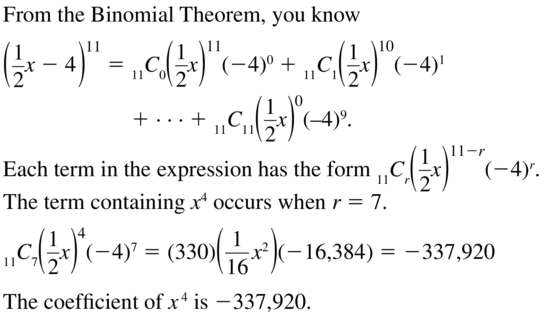
Question 66.
(\(\frac{1}{4}\)x + 6 )6, n = 3
Answer:
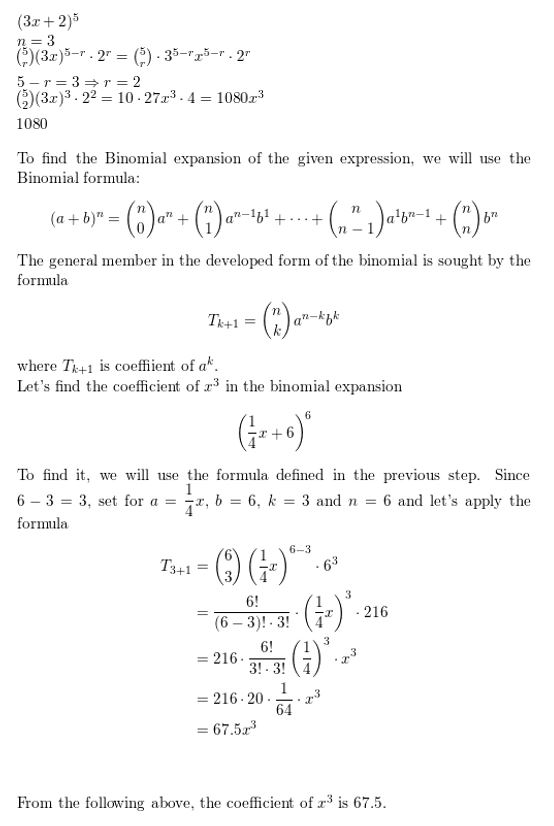
Question 67.
REASONING
Write the eighth row of Pascal’s Triangle as combinations and as numbers.
Answer:

Question 68.
PROBLEM SOLVING
The first four triangular numbers are 1, 3, 6, and 10.
a. Use Pascal’s Triangle to write the first four triangular numbers as combinations.
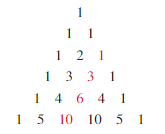
b. Use your result from part (a) to write an explicit rule for the nth triangular number Tn.
Answer:
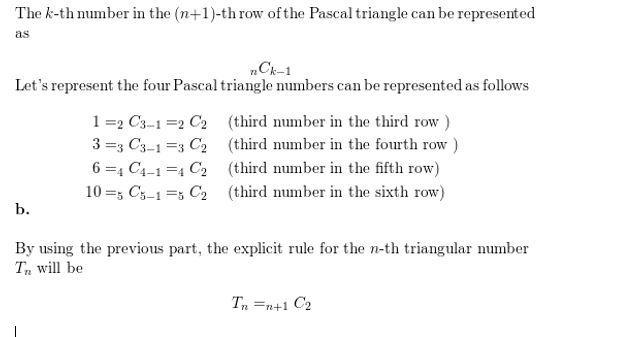
Question 69.
MATHEMATICAL CONNECTIONS
A polygon is convex when no line that contains a side of the polygon contains a point in the interior of the polygon. Consider a convex polygon with n sides.
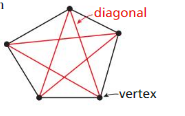
a. Use the combinations formula to write an expression for the number of diagonals in an n-sided polygon.
b. Use your result from part (a) to write a formula for the number of diagonals of an n-sided convex polygon.
Answer:
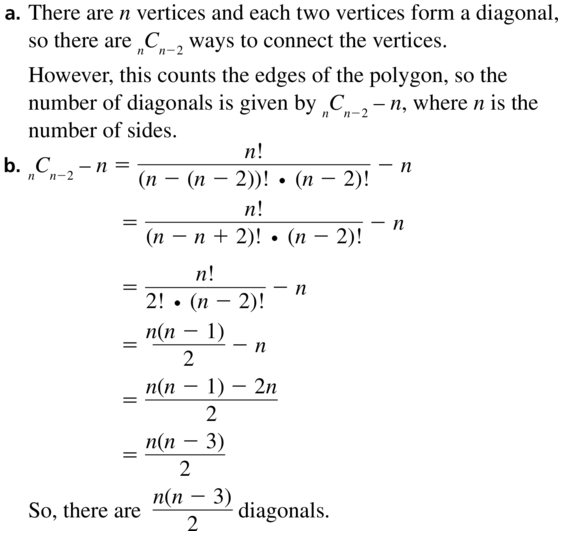
Question 70.
PROBLEM SOLVING
You are ordering a burrito with 2 main ingredients and 3 toppings. The menu below shows the possible choices. How many different burritos are possible?
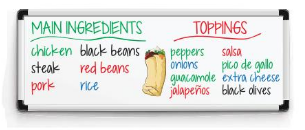
Answer:
You are ordering a burrito with 2 main ingredients and 3 toppings.
Total number of main ingredients = 6
As the order in which the ingredients are chosen is not important, the total number of ways to select 2 main ingredients out of 6 can be found by using the combinations formula.
nCa = n!/a!(n – a)!
6C2 = \(\frac{6!}{(6-2) !}\)
= \(\frac{6!}{4!}\) . \(\frac{1}{2!}\)
=6 . 5 . 4 . 3 . 2 . 1/(4 . 3 . 2 . 1)(2 . 1)
= 3 . 5
6C2 = 15
Total number of toppings = 8
Number of toppings to be chosen = 3
nCa = n!/a!(n – a)!
8C3 = \(\frac{8!}{(8-3) !}\)
= \(\frac{8!}{5!}\) . \(\frac{1}{3!}\)
=8 . 7 . 6 . 5 . 4 . 3 . 2 . 1/(5 . 4 . 3 . 2 . 1)(3 . 2 . 1)
= 8 . 7
8C3 = 56
Total possible selections = ways to select main ingredients × Ways to select toppings
= 15 × 56
= 840
Question 71.
PROBLEM SOLVING
You want to purchase 2 different types of contemporary music CDs and 1 classical music CD from the music collection shown. How many different sets of music types can you choose for your purchase?
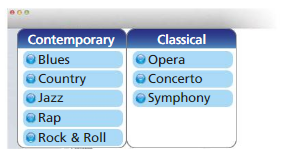
Answer:

Question 72.
PROBLEM SOLVING
Every student in your history class is required to present a project in front of the class. Each day, 4 students make their presentations in an order chosen at random by the teacher. You make your presentation on the first day.
a. What is the probability that you are chosen to be the first or second presenter on the first day?
b. What is the probability that you are chosen to be the second or third presenter on the first day? Compare your answer with that in part (a).
Answer:
Question 73.
PROBLEM SOLVING
The organizer of a cast party for a drama club asks each of the 6 cast members to bring 1 food item from a list of 10 items. Assuming each member randomly chooses a food item to bring, what is the probability that at least 2 of the 6 cast members bring the same item?
Answer:

Question 74.
HOW DO YOU SEE IT?
A bag contains one green marble, one red marble, and one blue marble. The diagram shows the possible outcomes of randomly drawing three marbles from the bag without replacement.
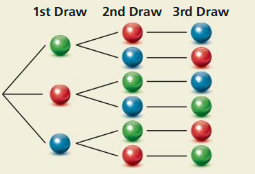
a. How many combinations of three marbles can be drawn from the bag? Explain.
b. How many permutations of three marbles can be drawn from the bag? Explain.
Answer:
Question 75.
PROBLEM SOLVING
You are one of 10 students performing in a school talent show. The order of the performances is determined at random. The first 5 performers go on stage before the intermission.
a. What is the probability that you are the last performer before the intermission and your rival performs immediately before you?
b. What is the probability that you are not the first performer?
Answer:
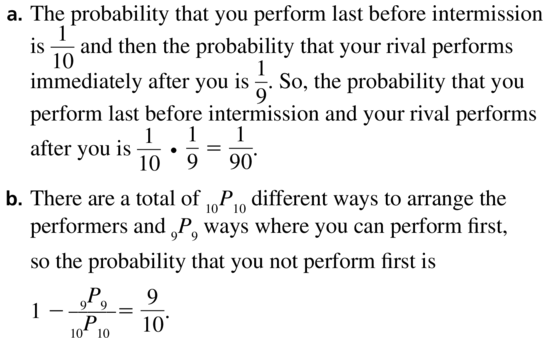
Question 76.
THOUGHT PROVOKING
How many integers, greater than 999 but not greater than 4000, can be formed with the digits 0, 1, 2, 3, and 4? Repetition of digits is allowed.
Answer:

Question 77.
PROBLEM SOLVING
Consider a standard deck of 52 playing cards. The order in which the cards are dealt for a “hand” does not matter.
a. How many different 5-card hands are possible?
b. How many different 5-card hands have all 5 cards of a single suit?

Answer:

Question 78.
PROBLEM SOLVING
There are 30 students in your class. Your science teacher chooses 5 students at random to complete a group project. Find the probability that you and your 2 best friends in the science class are chosen to work in the group. Explain how you found your answer.
Answer:

Question 79.
PROBLEM SOLVING
Follow the steps below to explore a famous probability problem called the birthday problem. (Assume there are 365 equally likely birthdays possible.)
a. What is the probability that at least 2 people share the same birthday in a group of 6 randomly chosen people? in a group of 10 randomly chosen people?
b. Generalize the results from part (a) by writing a formula for the probability P(n) that at least 2 people in a group of n people share the same birthday. (Hint: Use nPr notation in your formula.)
c. Enter the formula from part (b) into a graphing calculator. Use the table feature to make a table of values. For what group size does the probability that at least 2 people share the same birthday first exceed 50%?
Answer:
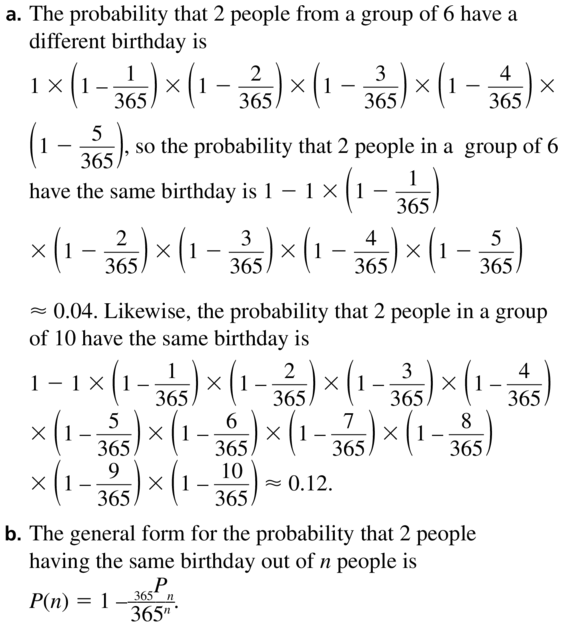
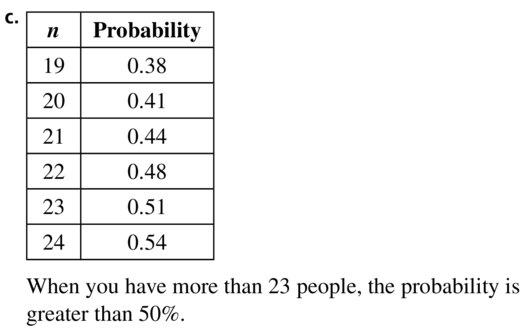
Maintaining Mathematical Proficiency
Question 80.
A bag contains 12 white marbles and 3 black marbles. You pick 1 marble at random. What is the probability that you pick a black marble?
Answer:
A bag contains 12 white marbles and 3 black marbles. You pick 1 marble at random

Question 81.
The table shows the result of flipping two coins 12 times. For what outcome is the experimental probability the same as the theoretical probability?

Answer:
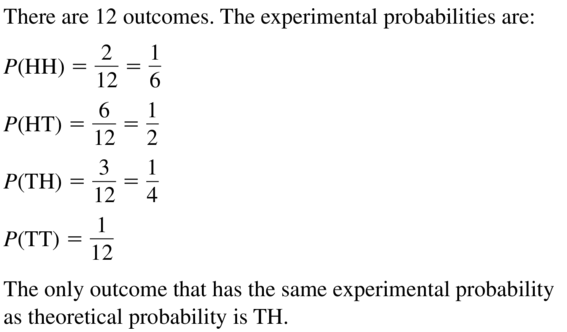
Lesson 10.6 Binomial Distributions
Essential Question How can you determine the frequency of each outcome of an event?
EXPLORATION 1
Analyzing Histograms
Work with a partner. The histograms show the results when n coins are flipped.
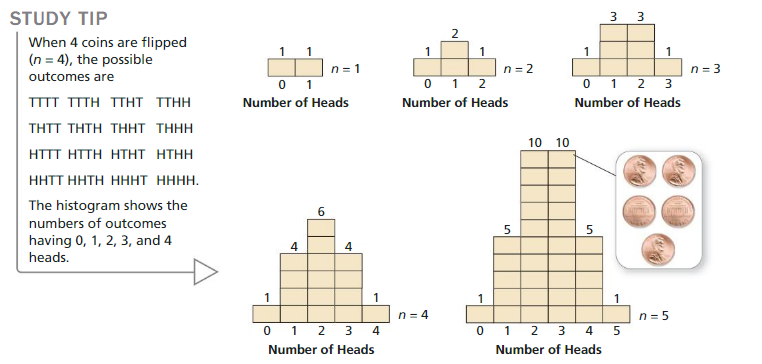
a. In how many ways can 3 heads occur when 5 coins are flipped?
Answer:
By the above histogram,
Combination of “0 Head” willl be 1 ,
A combination of “1 Head” will be 5,
A combination of “2 Heads” will be 10,
A combination of “3 Heads” will be 10,
A combination of “4 Heads” will be 5,
A combination of “5 Heads” will be 1.
Hence by using the Histogram, combinations of “3 Heads” will be 10
You can verify that by selecting this list from the sample space:
“HHHTT”, “HHTHT”, “HTHHT”, “THHHT”, “THHTH”. “THTHH”, “TTHHH”, “HTHTH”, “HTTHH” and “HHTTH”.
All have three Heads (and two Tail).
So 10 of the outcomes produce “Three Heads”.
b. Draw a histogram that shows the numbers of heads that can occur when 6 coins are flipped.
Answer:
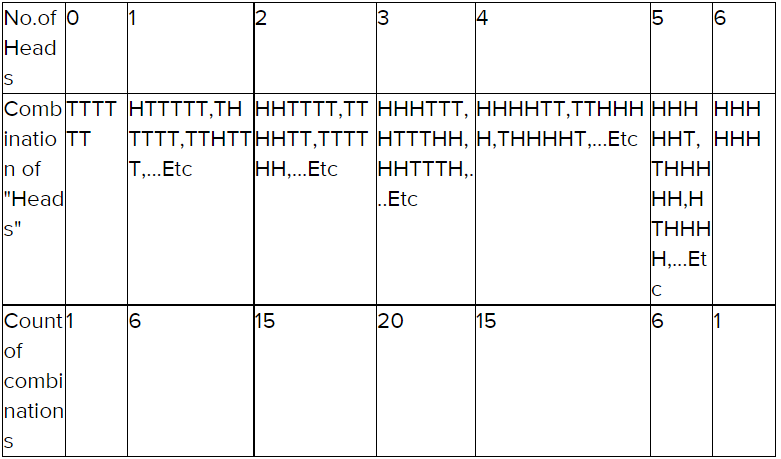
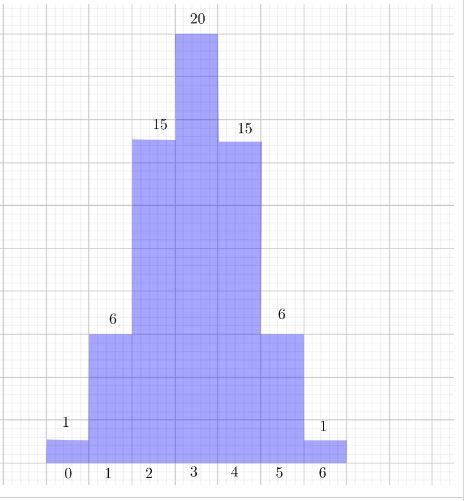
c. In how many ways can 3 heads occur when 6 coins are flipped?
Answer:
- Combination of 0 head will be 1.
- Combination of 1 head will be 6.
- Combination of 2 heads will be 15.
- Combination of 3 heads will be 20.
- Combination of 4 heads will be 15.
- Combination of 5 heads will be 6.
- Combination of 6 head will be 1.
6C3 = (6×5×4)/(1×2×3)
The possible outcome for 3 heads is 20.
EXPLORATION 2
Determining the Number of Occurrences
Work with a partner.
a. Complete the table showing the numbers of ways in which 2 heads can occur when n coins are flipped.

Answer:
Let X be the number of occurrences of 2 heads.
Occurences of 2 heads when n = 3
X3 = 3C2
X3 = 3
Occurences of 2 heads when n = 4
X4 = 4C2
X4 = 6
Occurences of 2 heads when n = 5
X5 = 5C2
X5 = 10
Occurences of 2 heads when n = 6
X6 = 6C2
X6 = 15
Occurences of 2 heads when n = 7
X7 = 7C2
X7 = 21

b. Determine the pattern shown in the table. Use your result to find the number of ways in which 2 heads can occur when 8 coins are flipped.
LOOKING FOR A PATTERN
To be proficient in math, you need to look closely to discern a pattern or structure.
Answer:
X3 = 3
X4 = 6
X5 = 10
X6 = 15
X7 = 21
X4 – X3 = 3
X5 – X4 = 4
X6 – X5 = 5
X7 – X6 = 6
X8 = X7 + 7
The number of occurrences of 2 heads when 8 coins are flipped will be 28.
Communicate Your Answer
Question 3.
How can you determine the frequency of each outcome of an event?
Answer: The frequency of each outcome of an event is determined by f = p/t
Question 4.
How can you use a histogram to find the probability of an event?
Answer: By checking the variables in the x-axis and its measurement of height, the probability of an event can be obtained.
Monitoring Progress
An octahedral die has eight sides numbered 1 through 8. Let x be a random variable that represents the sum when two such dice are rolled.
Question 1.
Make a table and draw a histogram showing the probability distribution for x.
Answer:
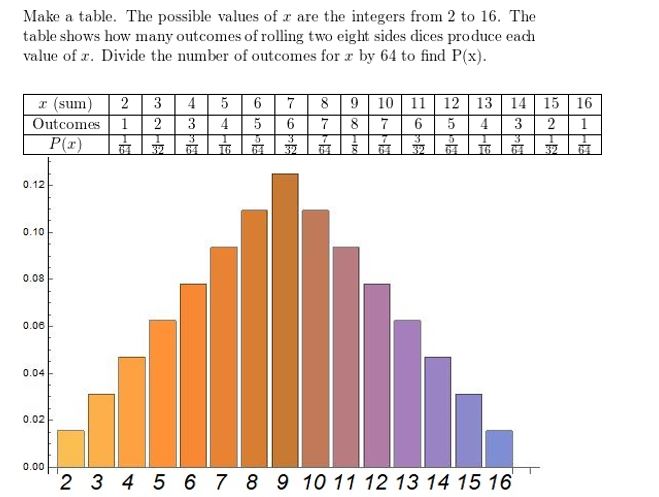
Question 2.
What is the most likely sum when rolling the two dice?
Answer:
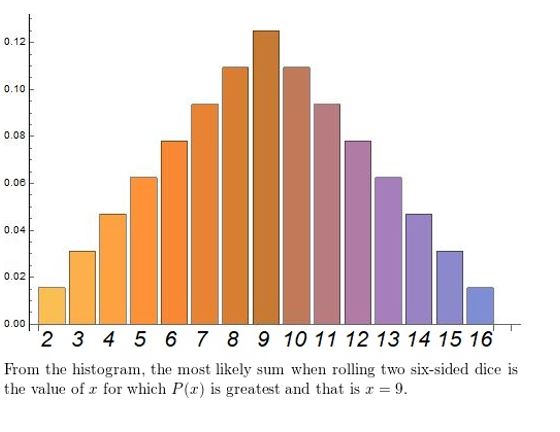
Question 3.
What is the probability that the sum of the two dice is at most 3?
Answer:
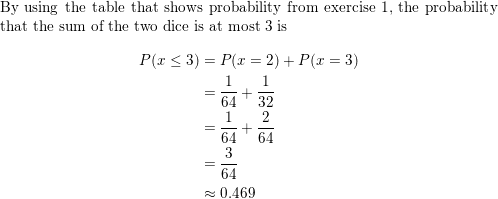
According to a survey, about 85% of people ages 18 and older in the U.S. use the Internet or e-mail. You ask 4 randomly chosen people (ages 18 and older) whether they use the Internet or e-mail.
Question 4.
Draw a histogram of the binomial distribution for your survey.
Answer:
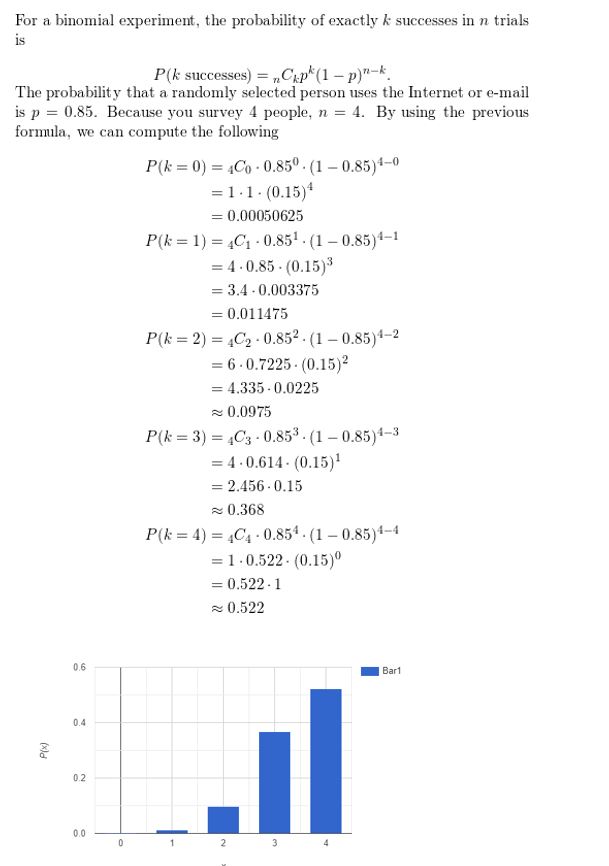
Question 5.
What is the most likely outcome of your survey?
Answer:

Question 6.
What is the probability that at most 2 people you survey use the Internet or e-mail?
Answer:

Binomial Distributions 10.6 Exercises
Vocabulary and Core Concept Check
Question 1.
VOCABULARY
What is a random variable?
Answer:

Question 2.
WRITING
Give an example of a binomial experiment and describe how it meets the conditions of a binomial experiment.
Answer:
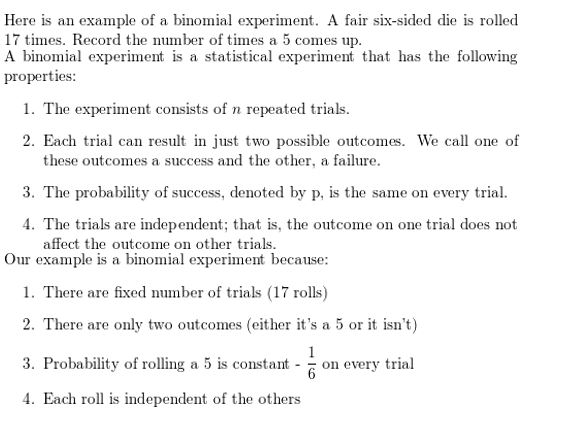
Monitoring Progress and Modeling with Mathematics
In Exercises 3–6, make a table and draw a histogram showing the probability distribution for the random variable.
Question 3.
x = the number on a table tennis ball randomly chosen from a bag that contains 5 balls labeled “1,” 3 balls labeled “2,” and 2 balls labeled “3.”
Answer:
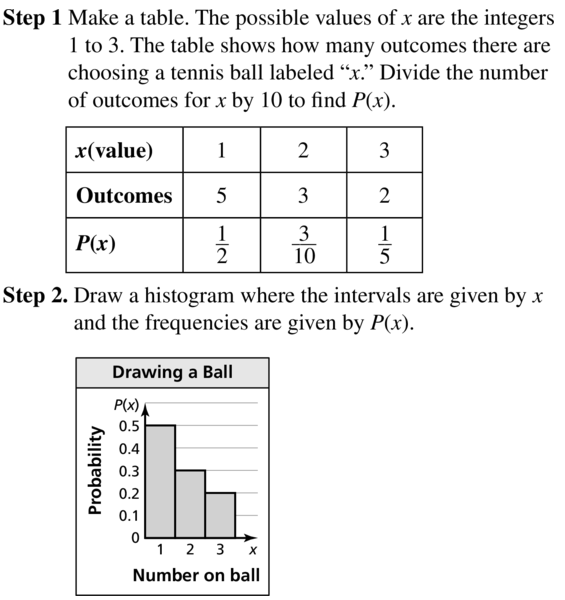
Question 4.
c = 1 when a randomly chosen card out of a standard deck of 52 playing cards is a heart and c = 2 otherwise.
Answer:

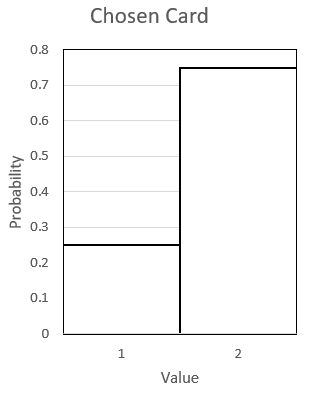
Question 5.
w = 1 when a randomly chosen letter from the English alphabet is a vowel and w = 2 otherwise.
Answer:
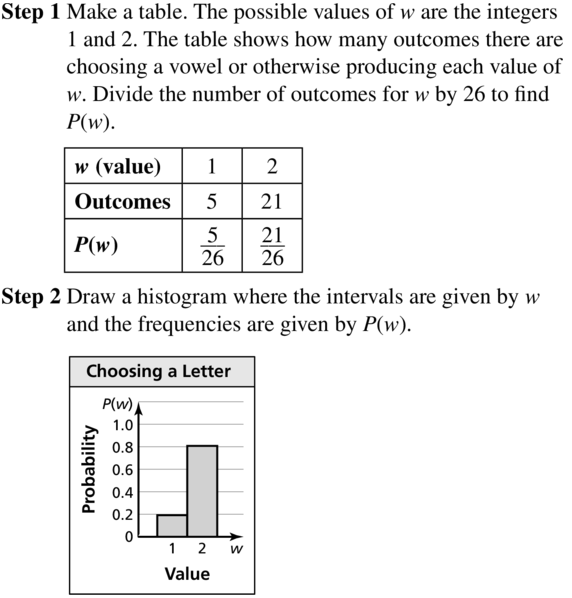
Question 6.
n = the number of digits in a random integer from 0 through 999.
Answer:
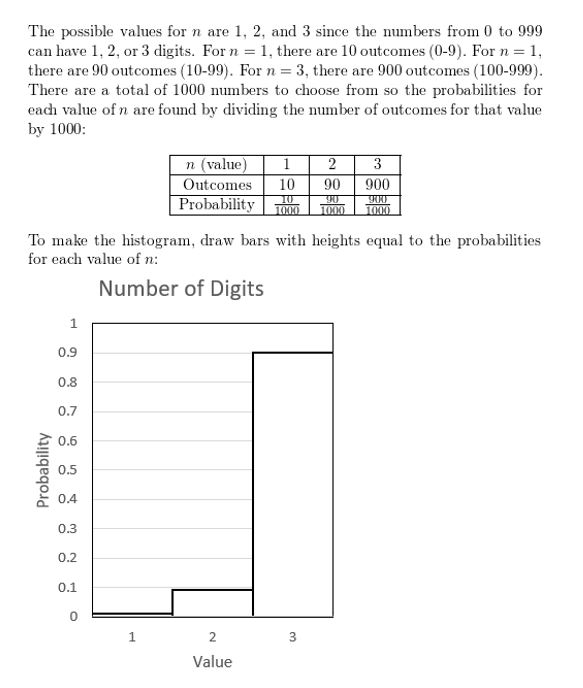
In Exercises 7 and 8, use the probability distribution to determine (a) the number that is most likely to be spun on a spinner, and (b) the probability of spinning an even number.
Question 7.
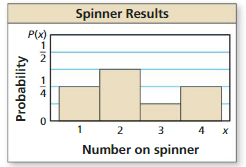
Answer:
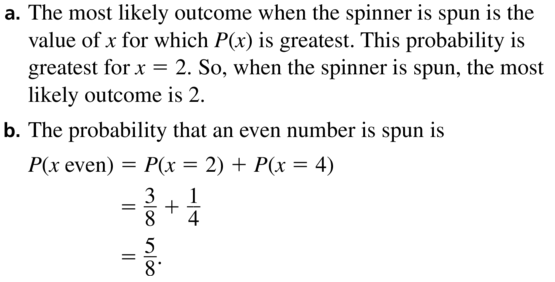
Question 8.
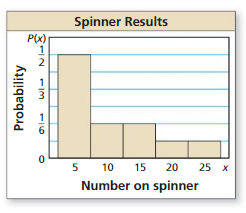
Answer:
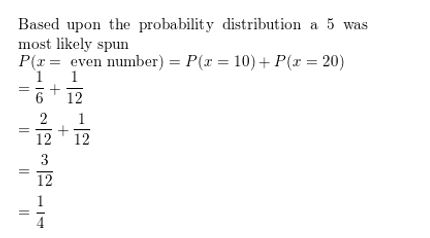
USING EQUATIONS In Exercises 9–12, calculate the probability of flipping a coin 20 times and getting the given number of heads.
Question 9.
1
Answer:
![]()
Question 10.
4
Answer:
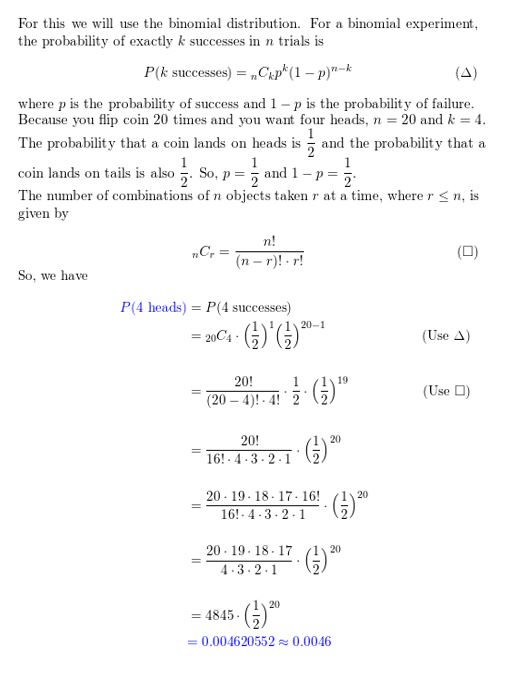
Question 11.
18
Answer:
![]()
Question 12.
20
Answer:
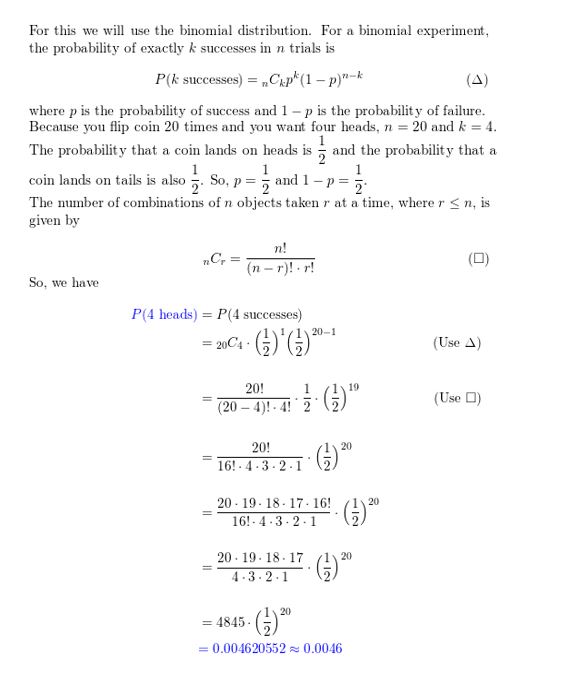
Question 13.
MODELING WITH MATHEMATICS
According to a survey, 27% of high school students in the United States buy a class ring. You ask 6 randomly chosen high school students whether they own a class ring.

a. Draw a histogram of the binomial distribution for your survey.
b. What is the most likely outcome of your survey?
c. What is the probability that at most 2 people have a class ring?
Answer:
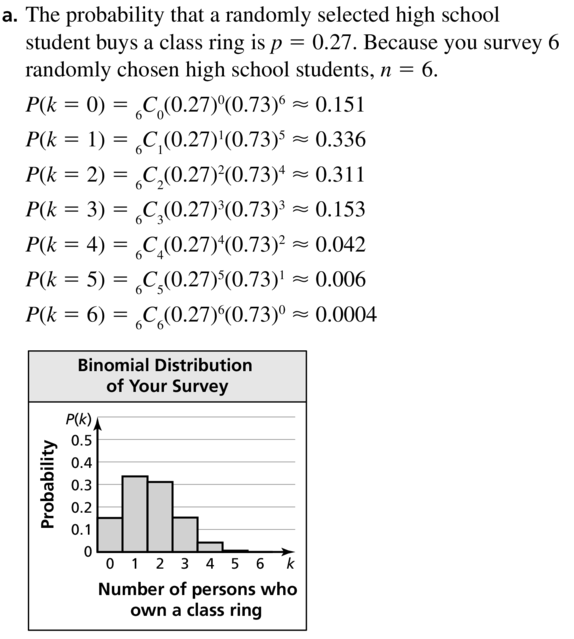
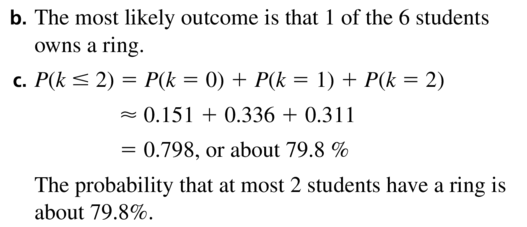
Question 14.
MODELING WITH MATHEMATICS
According to a survey, 48% of adults in the United States believe that Unidentified Flying Objects (UFOs) are observing our planet. You ask 8 randomly chosen adults whether they believe UFOs are watching Earth.
a. Draw a histogram of the binomial distribution for your survey.
b. What is the most likely outcome of your survey?
c. What is the probability that at most 3 people believe UFOs are watching Earth?
Answer:
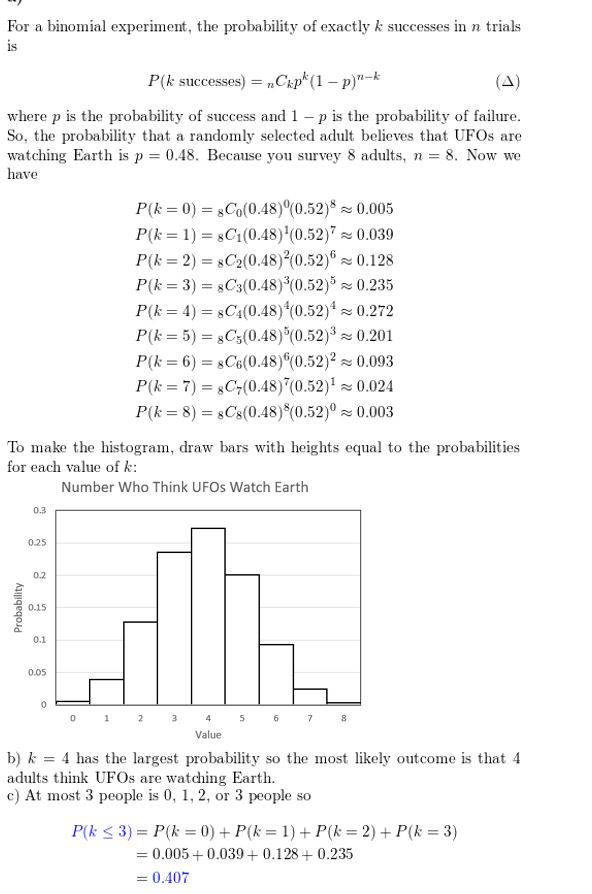
ERROR ANALYSIS In Exercises 15 and 16, describe and correct the error in calculating the probability of rolling a 1 exactly 3 times in 5 rolls of a six-sided die.
Question 15.

Answer:

Question 16.

Answer:
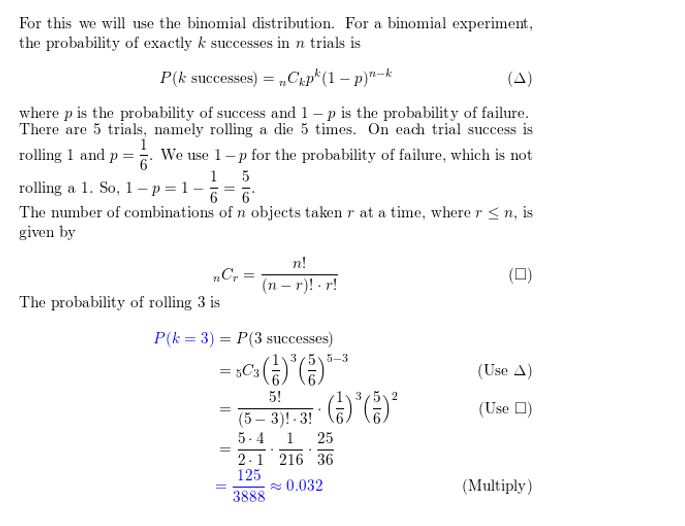
Question 17.
MATHEMATICAL CONNECTIONS
At most 7 gopher holes appear each week on the farm shown. Let x represent how many of the gopher holes appear in the carrot patch. Assume that a gopher hole has an equal chance of appearing at any point on the farm.
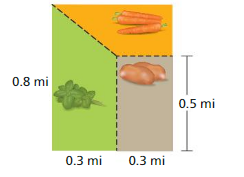
a. Find P(x) for x= 0, 1, 2, . . . , 7.
b. Make a table showing the probability distribution for x.
c. Make a histogram showing the probability distribution for x.
Answer:
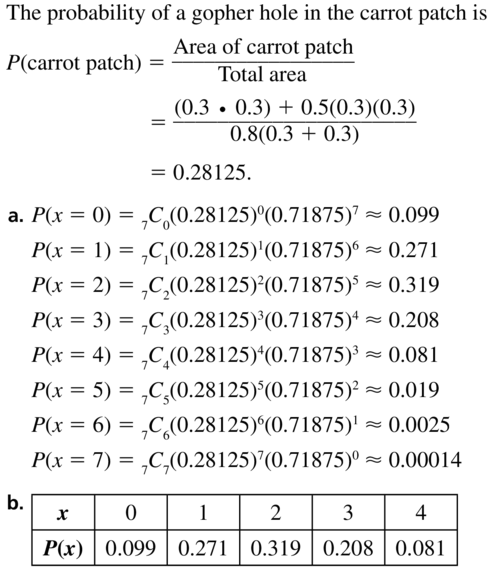
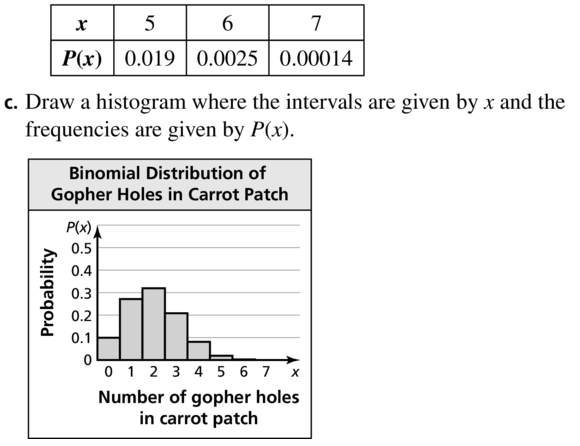
Question 18.
HOW DO YOU SEE IT?
Complete the probability distribution for the random variable x. What is the probability the value of x is greater than 2?

Answer:
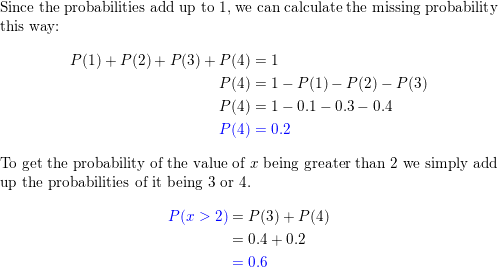
Question 19.
MAKING AN ARGUMENT
The binomial distribution shows the results of a binomial experiment. Your friend claims that the probability p of a success must be greater than the probability 1 −p of a failure. Is your friend correct? Explain your reasoning.
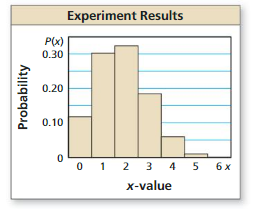
Answer:

Question 20.
THOUGHT PROVOKING
There are 100 coins in a bag. Only one of them has a date of 2010. You choose a coin at random, check the date, and then put the coin back in the bag. You repeat this 100 times. Are you certain of choosing the 2010 coin at least once? Explain your reasoning.
Answer:
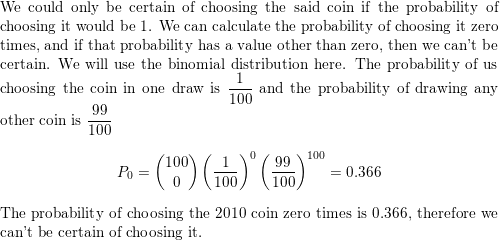
Question 21.
MODELING WITH MATHEMATICS
Assume that having a male and having a female child are independent events, and that the probability of each is 0.5.
a. A couple has 4 male children. Evaluate the validity of this statement: “The first 4 kids were all boys, so the next one will probably be a girl.”
b. What is the probability of having 4 male children and then a female child?
c. Let x be a random variable that represents the number of children a couple already has when they have their first female child. Draw a histogram of the distribution of P(x) for 0 ≤ x ≤ 10. Describe the shape of the histogram.
Answer:
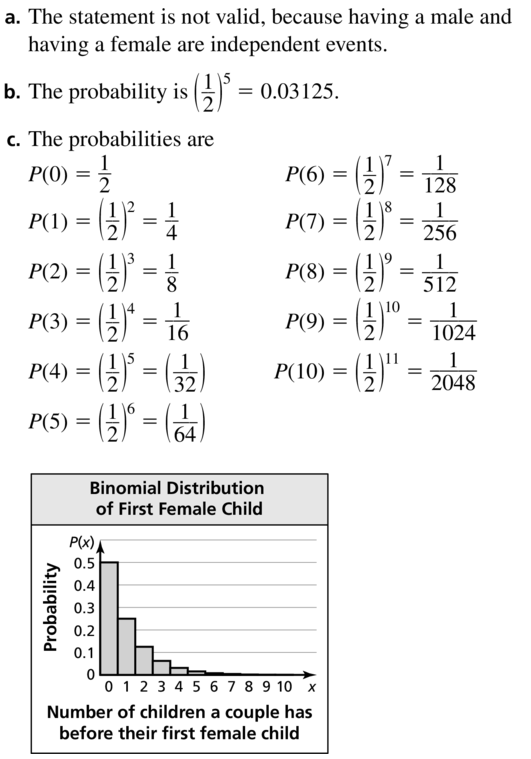
Question 22.
CRITICAL THINKING
An entertainment system has n speakers. Each speaker will function properly with probability p, independent of whether the other speakers are functioning. The system will operate effectively when at least 50% of its speakers are functioning. For what values of p is a 5-speaker system more likely to operate than a 3-speaker system?
Answer:
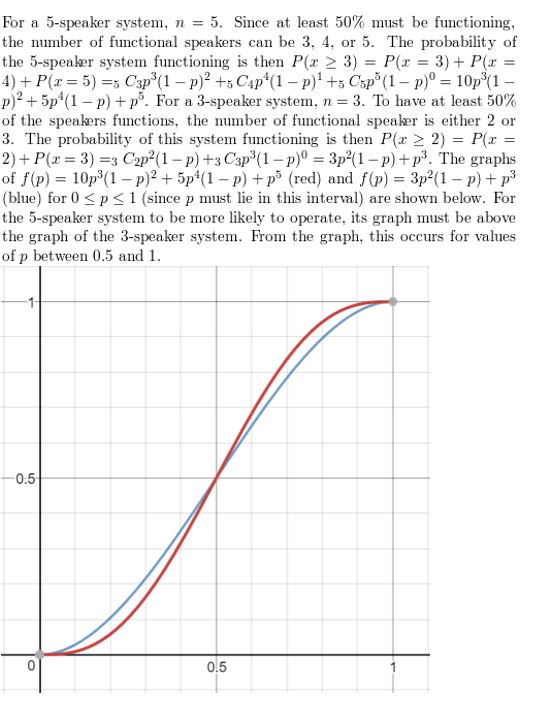
Maintaining Mathematical Proficiency
List the possible outcomes for the situation.
Question 23.
guessing the gender of three children
Answer:

Question 24.
picking one of two doors and one of three curtains
Answer:
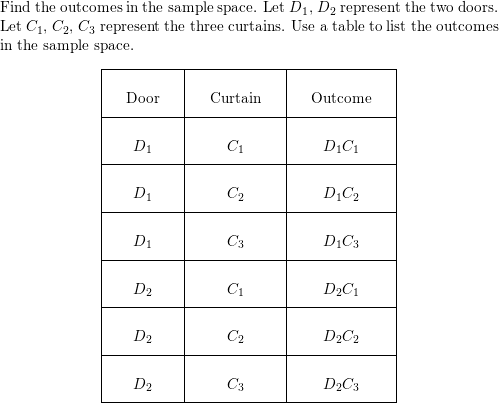
Probability Performance Task: A New Dartboard
10.4–10.6 What Did You Learn?
Core Vocabulary

Core Concepts
Section 10.4
Probability of Compound Events, p. 564
Section 10.5Permutations, p. 571Combinations, p. 572
The Binomial Theorem, p. 574
Section 10.6
Probability Distributions, p. 580
Binomial Experiments, p. 581
Mathematical Practices
Question 1.
How can you use diagrams to understand the situation in Exercise 22 on page 568?
Answer:
Question 2.
Describe a relationship between the results in part (a) and part (b) in Exercise 74 on page 578.
Answer:
Question 3.
Explain how you were able to break the situation into cases to evaluate the validity of the statement in part (a) of Exercise 21 on page 584.
Answer:
Performance Task A New Dartboard
You are a graphic artist working for a company on a new design for the board in the game of darts. You are eager to begin the project, but the team cannot decide on the terms of the game. Everyone agrees that the board should have four colors. But some want the probabilities of hitting each color to be equal, while others want them to be different. You offer to design two boards, one for each group. How do you get started? How creative can you be with your designs?
To explore the answers to these questions and more, go to BigIdeasMath.com.

Probability Chapter Review
10.1 Sample Spaces and Probability (pp. 537–544)
Question 1.
A bag contains 9 tiles, one for each letter in the word HAPPINESS. You choose a tile at random. What is the probability that you choose a tile with the letter S? What is the probability that you choose a tile with a letter other than P?
Answer:
Question 2.
You throw a dart at the board shown. Your dart is equally likely to hit any point inside the square board. Are you most likely to get 5 points, 10 points, or 20 points?
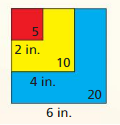
Answer:
10.2 Independent and Dependent Events (pp. 545–552)
Find the probability of randomly selecting the given marbles from a bag of 5 red, 8 green, and 3 blue marbles when (a) you replace the first marble before drawing the second, and (b) you do not replace the first marble. Compare the probabilities.
Question 3.
red, then green
Answer:
Question 4.
blue, then red
Answer:
Question 5.
green, then green
Answer:
10.3 Two-Way Tables and Probability (pp. 553–560)
Question 6.
What is the probability that a randomly selected resident who does not support the project in the example above is from the west side?
Answer:
Question 7.
After a conference, 220 men and 270 women respond to a survey. Of those, 200 men and 230 women say the conference was impactful. Organize these results in a two-way table. Then find and interpret the marginal frequencies.
Answer:
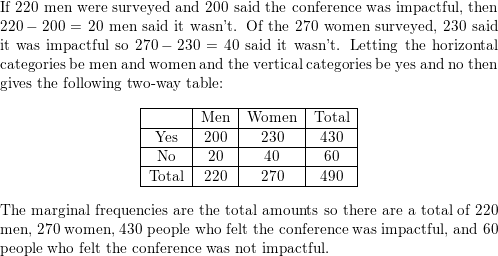
10.4 Probability of Disjoint and Overlapping Events (pp. 563–568)
Question 8.
Let A and B be events such that P(A) = 0.32, P(B) = 0.48, and P(A and B) = 0.12. Find P(A or B).
Answer:
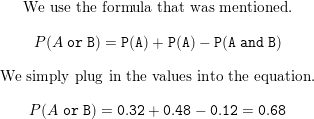
Question 9.
Out of 100 employees at a company, 92 employees either work part time or work 5 days each week. There are 14 employees who work part time and 80 employees who work 5 days each week. What is the probability that a randomly selected employee works both part time and 5 days each week?
Answer:
P(A or B) = P(A) + P(B) – P(A and B)
92/100 = 14/100 + 80/100 – P(A and B)
P(A and B) = 14/100 + 80/100 – 92/100
P(A and B) = 2/100
10.5 Permutations and Combinations (pp. 569–578)
Evaluate the expression.
Question 10.
7P6
Answer:
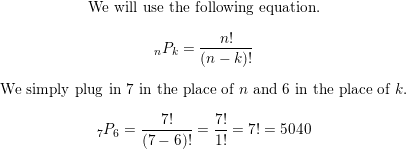
Question 11.
13P10
Answer:

Question 12.
6C2
Answer:

Question 13.
8C4
Answer:

Question 14.
Use the Binomial Theorem to write the expansion of (2x + y2)4.
Answer:
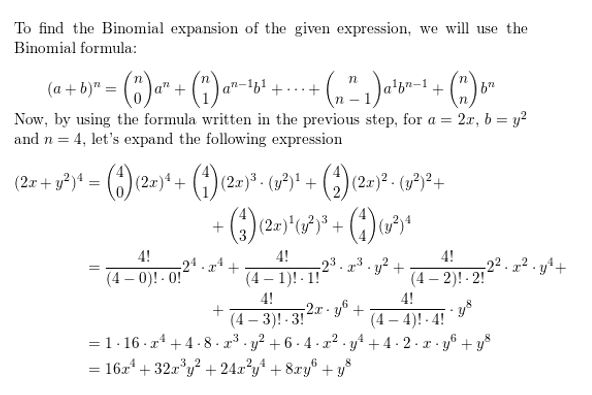
Question 15.
A random drawing will determine which 3 people in a group of 9 will win concert tickets. What is the probability that you and your 2 friends will win the tickets?
Answer:
nCa = n!/a!(n – a)!
9C3 = 9!/3!(9 – 3)!
= 9!/3!(6)!
= 9 . 8 . 7 6 . 5 . 4 . 3 . 2 . 1/(3 . 2 . 1)(6 . 5 . 4 . 3 . 2 . 1)
= 84
9C3 = 84
The probability that you and your 2 friends will win the tickets is equal to the probability that out of 84 possibilities, the trio in which you and your friend are in will be chosen.
P = Number of favorable outcomes/ Total number of outcomes = 1/84
10.6 Binomial Distributions (pp. 579–584)
Question 16.
Find the probability of flipping a coin 12 times and getting exactly 4 heads.
Answer:
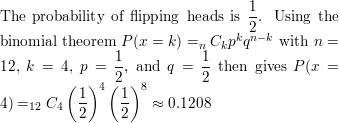
Question 17.
A basketball player makes a free throw 82.6% of the time. The player attempts 5 free throws. Draw a histogram of the binomial distribution of the number of successful free throws. What is the most likely outcome?
Answer:
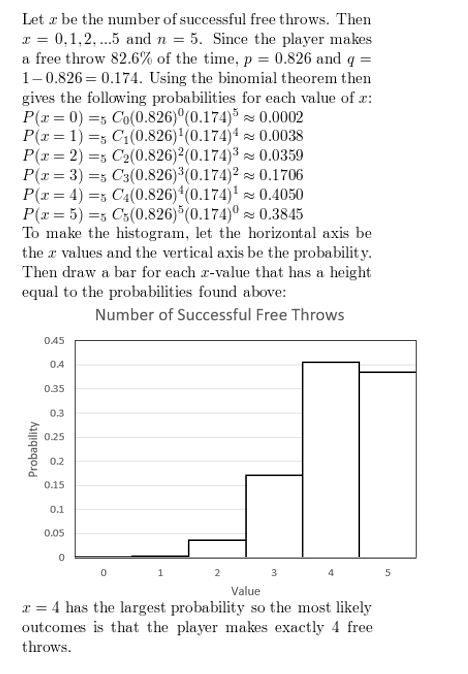
Probability Chapter Test
You roll a six-sided die. Find the probability of the event described. Explain your reasoning.
Question 1.
You roll a number less than 5.
Answer:

Question 2.
You roll a multiple of 3.
Answer:

Evaluate the expression.
Question 3.
7P2
Answer:
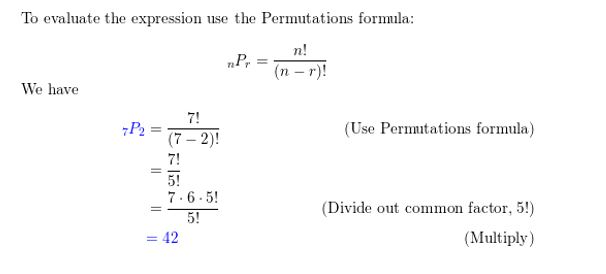
Question 4.
8P3
Answer:
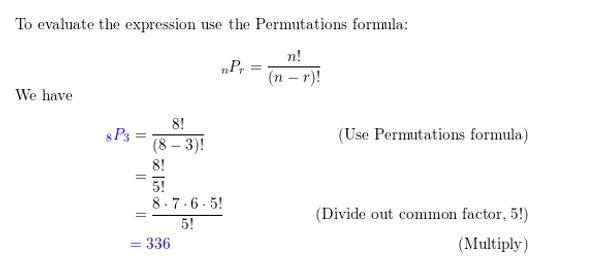
Question 5.
6C3
Answer:
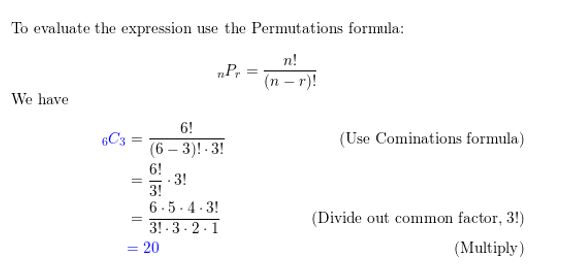
Question 6.
12C7
Answer:
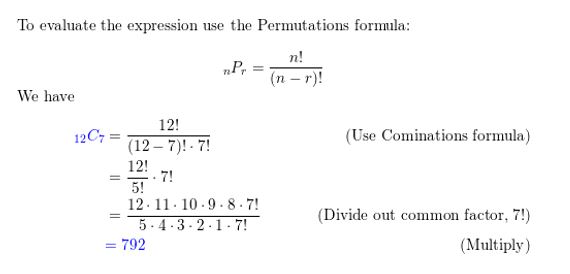
Question 7.
Use the Binomial Theorem to write the binomial expansion of (x + y2)5.
Answer:
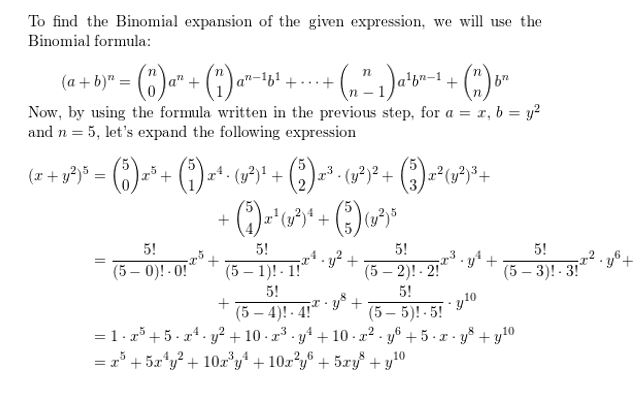
Question 8.
You find the probability P(A or B) by using the equation P(A or B) = P(A) + P(B) − P(A and B). Describe why it is necessary to subtract P(A and B) when the events A and B are overlapping. Then describe why it is not necessary to subtract P(A and B) when the events A and B are disjoint.
Answer:

Question 9.
Is it possible to use the formula P(A and B) =P(A) • P(B|A) when events A and B are independent? Explain your reasoning.
Answer:
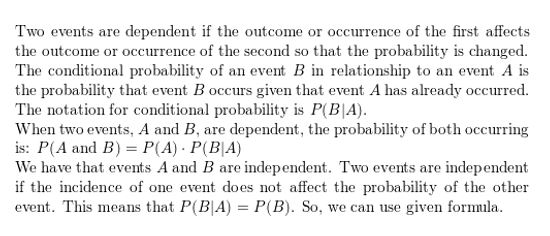
Question 10.
According to a survey, about 58% of families sit down for a family dinner at least four times per week. You ask 5 randomly chosen families whether they have a family dinner at least four times per week.
a. Draw a histogram of the binomial distribution for the survey.
b. What is the most likely outcome of the survey?
c. What is the probability that at least 3 families have a family dinner four times per week?
Answer:
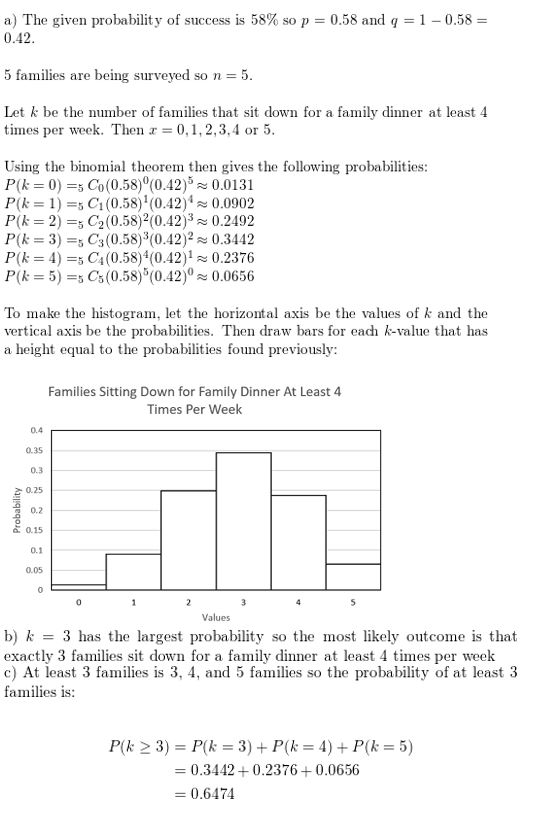
Question 11.
You are choosing a cell phone company to sign with for the next 2 years. The three plans you consider are equally priced. You ask several of your neighbors whether they are satisfied with their current cell phone company. The table shows the results. According to this survey, which company should you choose?
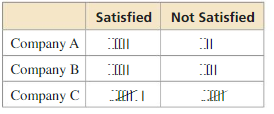
Answer:
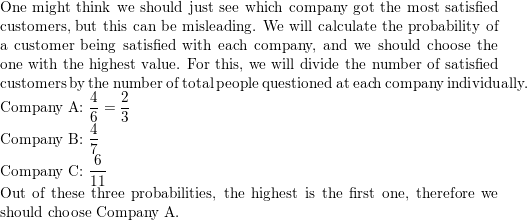
Question 12.
The surface area of Earth is about 196.9 million square miles. The land area is about 57.5 million square miles and the rest is water. What is the probability that a meteorite that reaches the surface of Earth will hit land? What is the probability that it will hit water?
Answer:
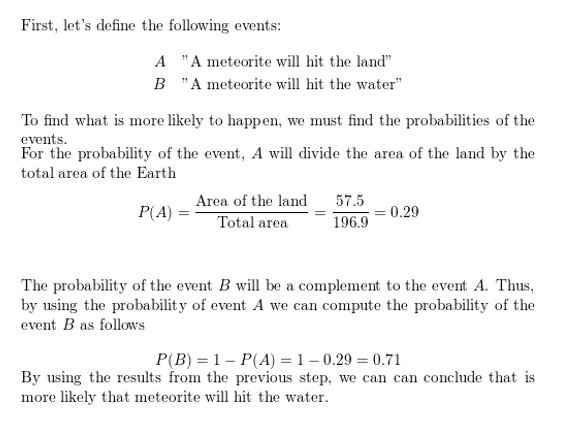
Question 13.
Consider a bag that contains all the chess pieces in a set, as shown in the diagram.
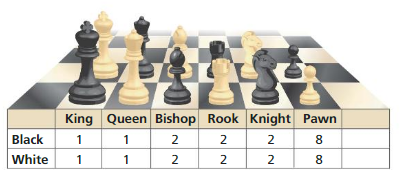
a. You choose one piece at random. Find the probability that you choose a black piece or a queen.
b. You choose one piece at random, do not replace it, then choose a second piece at random. Find the probability that you choose a king, then a pawn.
Answer:
Question 14.
Three volunteers are chosen at random from a group of 12 to help at a summer camp.
a. What is the probability that you, your brother, and your friend are chosen?
b. The first person chosen will be a counselor, the second will be a lifeguard, and the third will be a cook. What is the probability that you are the cook, your brother is the lifeguard, and your friend is the counselor?
Answer:
Probability Cumulative Assessment
Question 1.
According to a survey, 63% of Americans consider themselves sports fans. You randomly select 14 Americans to survey.
a. Draw a histogram of the binomial distribution of your survey.
b. What is the most likely number of Americans who consider themselves sports fans?
c. What is the probability at least 7 Americans consider themselves sports fans?
Answer:
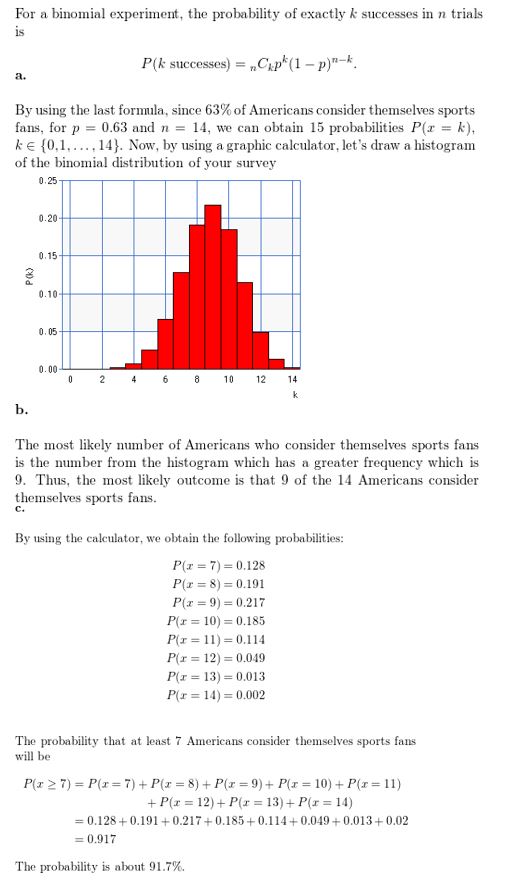
Question 2.
Order the acute angles from smallest to largest. Explain your reasoning.
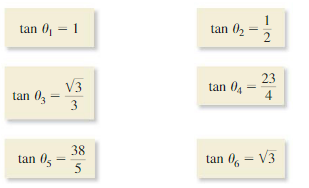
Answer:
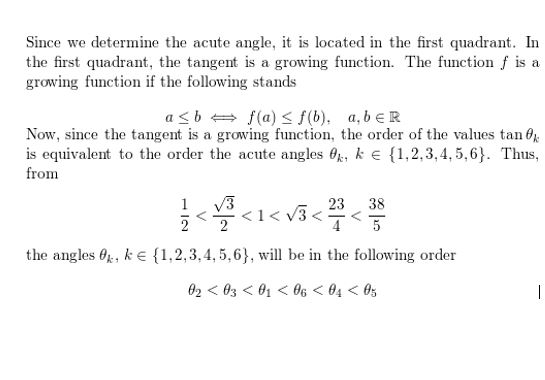
Question 3.
You order a fruit smoothie made with 2 liquid ingredients and 3 fruit ingredients from the menu shown. How many different fruit smoothies can you order?
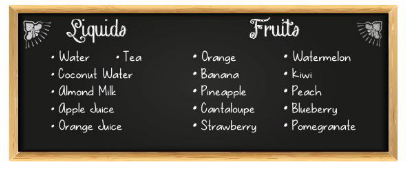
Answer:
Question 4.
Which statements describe the transformation of the graph of f(x) = x3 − x represented by g(x) = 4(x − 2)3 − 4(x − 2)?
A. a vertical stretch by a factor of 4
B. a vertical shrink by a factor of \(\frac{1}{4}\)
C. a horizontal shrink by a factor of \(\frac{1}{4}\)
D. a horizontal stretch by a factor of 4
E. a horizontal translation 2 units to the right
F. a horizontal translation 2 units to the left
Answer:
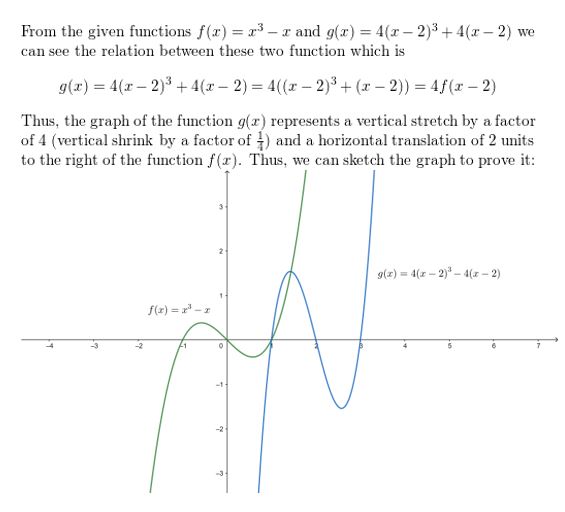
Question 5.
Use the diagram to explain why the equation is true. P(A) + P(B) = P(A or B) + P(A and B)

Answer:
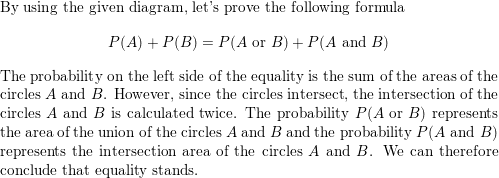
Question 6.
For the sequence \(-\frac{1}{2},-\frac{1}{4},-\frac{1}{6},-\frac{1}{8}, \ldots\) describe the pattern, write the next term, graph the first five terms, and write a rule for the nth term.
Answer:
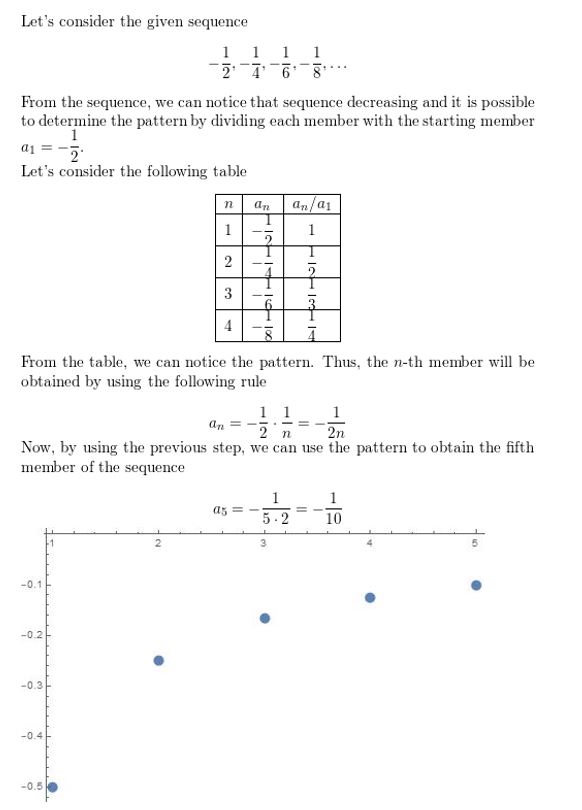
Question 7.
A survey asked male and female students about whether they prefer to take gym class or choir. The table shows the results of the survey.
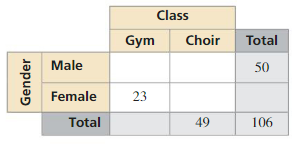
a. Complete the two-way table.
b. What is the probability that a randomly selected student is female and prefers choir?
c. What is the probability that a randomly selected male student prefers gym class?
Answer:
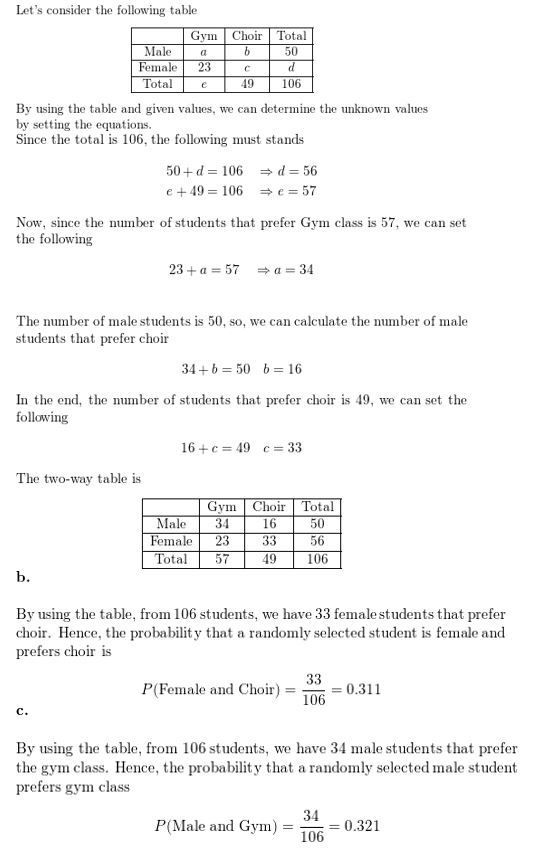
Question 8.
The owner of a lawn-mowing business has three mowers. As long as one of the mowers is working, the owner can stay productive. One of the mowers is unusable 10% of the time, one is unusable 8% of the time, and one is unusable 18% of the time.
a. Find the probability that all three mowers are unusable on a given day.
Answer:
P(A) = 10% = 0.1
P(B) = 8% = 0.08
P(C) = 18% = 0.18
\(\bar{A}\) = {The first mower is usable}
\(\bar{B}\) = {The second mower is usable}
\(\bar{C}\) = {The third mower is usable}
P(\(\bar{A}\)) = 1 – 0.1 = 0.9
P(\(\bar{B}\)) = 1 – 0.08 = 0.92
P(\(\bar{C}\)) = 1 – 0.18 = 0.82
Event that all three mowers are unusable on a given day is A and B and C. If we assume that the operation of the mowers are independent, then we get the probability that all three mowers are unusable on a given day as
P(A and B and C) = P(A) . P(B) . P(C) = 0.1 × 0.08 × 0.18 = 0.00144
b. Find the probability that at least one of the mowers is unusable on a given day.
Answer:
Event at least one of mowers is unusable on a given day is equivalent to event one of mowers is unusable on a given day or two of mowers is unusable on a given day.
A and \(\bar{B}\) and \(\bar{C}\) or \(\bar{A}\) and B and \(\bar{C}\) or \(\bar{A}\) and \(\bar{B}\) and C
On the other hand, event two of mowers is unusable on a given day is
A and B and \(\bar{C}\) or \(\bar{A}\) and B and C or A and \(\bar{B}\) and C
P(A and \(\bar{B}\) and \(\bar{C}\)) + P(\(\bar{A}\) and B and \(\bar{C}\)) + P(\(\bar{A}\) and \(\bar{B}\) and C)
= 0.1 × 0.92 × 0.82 + 0.9 × 0.08 × 0.82 + 0.9 × 0.92 × 0.18
= 0.28352
P(A and \(\bar{B}\) and \(\bar{C}\)) + P(\(\bar{A}\) and B and \(\bar{C}\)) + P(\(\bar{A}\) and \(\bar{B}\) and C)
= 0.1 × 0.08 × 0.82 + 0.9 × 0.08 × 0.18 + 0.1 × 0.92 × 0.18
= 0.03608
P(At least one of mowers is unusable) = P(One of mowers is unusable) + P(two of mowers is unusable)
= 0.28352 + 0.03608
= 0.3196
c. Suppose the least-reliable mower stops working completely. How does this affect the probability that the lawn-moving business can be productive on a given day?
Answer:
If the least-reliable mower stops working completely, this will not affect the probability that the lawn mowing business can be productive on a given day, because we know that as long as one of the mowers is working, the owner can stay productive.
Question 9.
Write a system of quadratic inequalities whose solution is represented in the graph.
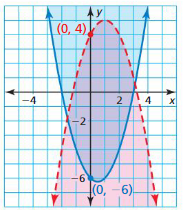
Answer:
