Practice with the help of enVision Math Common Core Grade 2 Answer Key Topic 15 Graphs and Data regularly and improve your accuracy in solving questions.
enVision Math Common Core 2nd Grade Answers Key Topic 15 Graphs and Data
Essential Question:
How can line plots, bar graphs, and picture graphs be used to show data and answer questions?
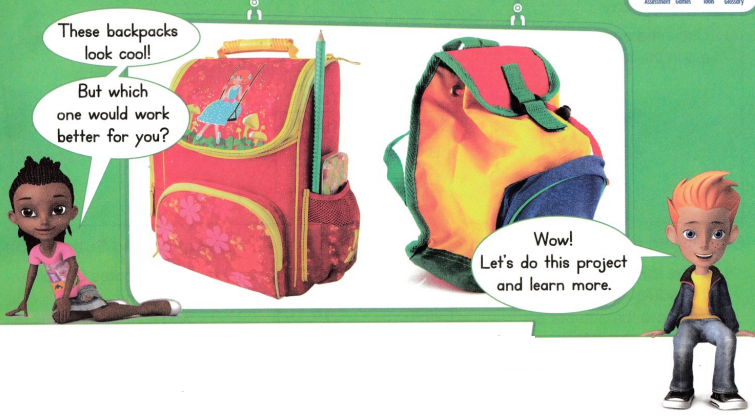
enVision STEM Project: Comparing Objects and Data
Find Out Work with a partner. Compare two backpacks. Which one holds more? Which one has more parts? Which one is easier to put on? Think of other ways to compare.
Journal: Make a Book Show what you learn in a book. In your book, also:
- Tell one good thing and one bad thing about each backpack.
- Draw line plots, picture graphs, and bar graphs to show and compare data.
Review What You Know
Vocabulary
Question 1.
Circle the number that has a 6 in the tens place.
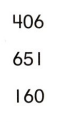
Answer:
6 in the ten’s place is 160. so circle the 169.
Question 2.
Circle the tally marks that show 6.
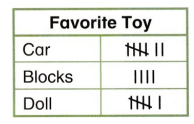
Answer: tally marks that show 6 is is a doll.
Question 3.
Circle the difference.
22 – 9 = 13
34 + 61 = 95
Answer:
From the given 22 – 9 = 13 is the difference. So circle the difference.
Comparing Numbers
Question 4.
A zoo has 405 snakes. It has 375 monkeys. Compare the number of snakes to the number of monkeys.
Write > or <.
405 ![]() 375
375
Answer:
Given that,
Zoo has 405 snakes and 357 monkeys.
405 > 375
Interpret Data
Question 5.
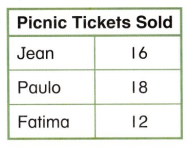
Who sold the most picnic tickets?
Answer:
Given that,
Picnic tickets sold by Jean = 16
Picnic tickets sold by Paulo = 18
Picnic tickets sold by Fatima = 12
Therefore Paulo sold the most picnic tickets.
Addition and Subtraction
Question 6.
Byron scores 24 points in a game. Ava scores 16 points in the same game. How many more points does Byron score than Ανα?
________ more points
Answer:
Given that,
Byron scores in a game = 24 points
Ava scores in a game = 16 points
Byron scores than Ava = 24 – 16 = 8
Byron scores 8 points more than Ava.
Pick a Project
PROJECT 15A
What types of flowers grow in your neighborhood?
Project: Graph Data About Flowers

PROJECT 15B
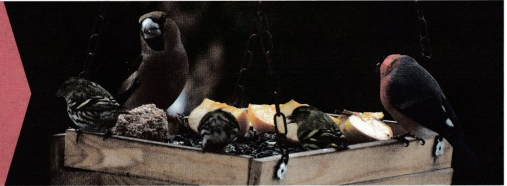
How many birds do you see every day?
Project: Create a Bird-Watching Poster
PROJECT 15C
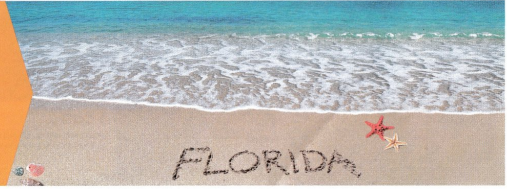
Why should you plan a Florida vacation?
Project: Make a Florida Travel Brochure
3-ACT MATH PREVIEW
Before watching the video, think: How do you know what size clothing you should wear? Is there a way you can find out without trying the clothes on?

I can … model with math to solve a problem that involves making graphs to study data.
Lesson 15.1 Line Plots
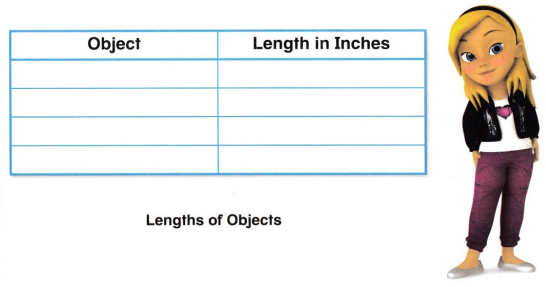
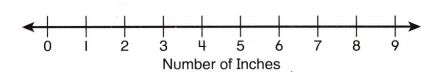
Solve & Share
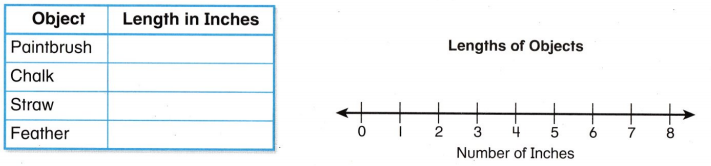
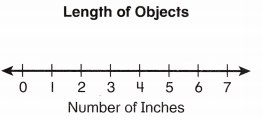
Find four objects that are each shorter than 9 inches. Measure the length of each object to the nearest inch. Record the measurements in the table. Then plot the data on the number line. Which object is longest? Which is shortest?
I can … measure the lengths of objects, then make a line plot to organize the data.
Visual Learning Bridge
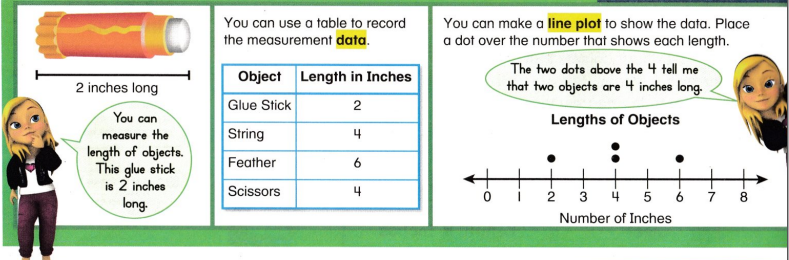
Convince Me! Measure the length of your pencil to the nearest inch. Record your measurement on the line plot above. How does it change the data?
Guided Practice
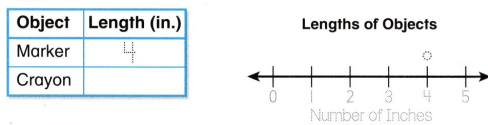
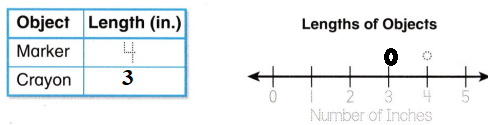
Use a ruler to measure each object in inches. Record each length in the table. Then make a line plot. Show each length on the line plot.
Question 1.
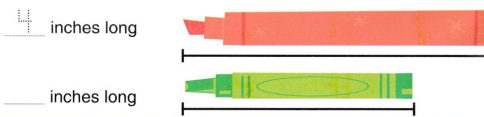
Answer: 3 inches long.
Question 2.
Answer:
Independent Practice
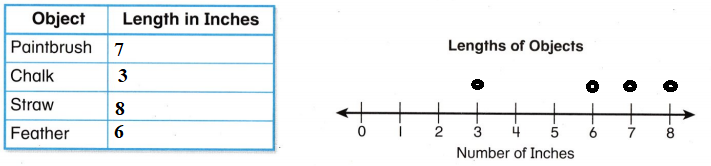
Use a ruler to measure each object in inches. Record each + Practice length in the table. Show each length on the line plot.
Question 3.
The paintbrush is ________ inches long.
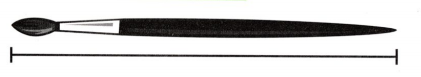
Answer: the paintbrush is 7 inches long.
Question 4.
The chalk is _______ inches long.
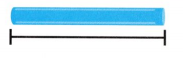
Answer: the chalk is 3 inches long.
Question 5.
The straw is ________ inches long.
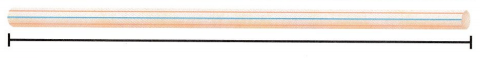
Answer: the straw is 8 inches long.
Question 6.
The feather is ________ inches long.
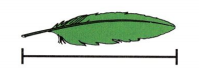
Answer:
The feather is 6 inches long.
Question 7.
Answer:
Problem Solving
Solve each problem. Use the line plot.
Question 8.
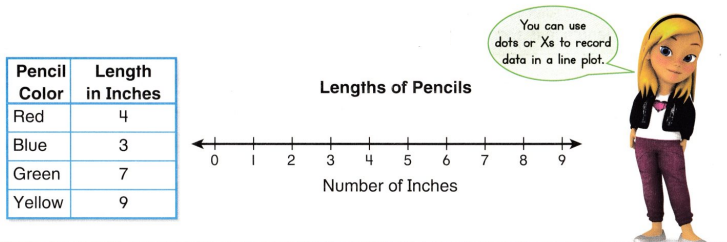
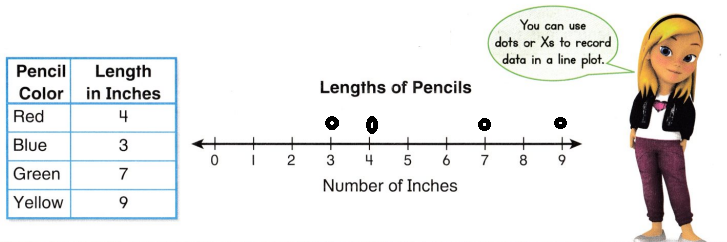
Be Precise Sophia measured the lengths of her colored pencils and made a table. Use the data to make a line plot.
Answer:
Question 9.
What is the length of the shortest pencil? Explain.
Answer:
Blue pencil is the shortest length in pencils.
Question 10.
Higher Order Thinking What are the lengths of the two pencils have a total length of 16 inches? Explain.
Answer:
Given that,
The length of the green pencil = 7 inches
The length of the yellow pencil = 9 inches
Adding of green pencil and yellow pencil = 16 inches
Question 11.
Assessment Practice Measure the length of the purple pencil in inches. Write the length below. Record your measurement on the line plot above in Item 8.
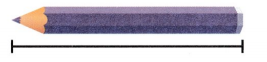
_________ inches
Answer: the length of the purple pencil is 4 inches long.
Lesson 15.2 More Line Plots
Solve & Share
Measure the length of your shoe to the nearest inch. Then use your data and data from your class to make a line plot. Tell one thing you learn from the data.
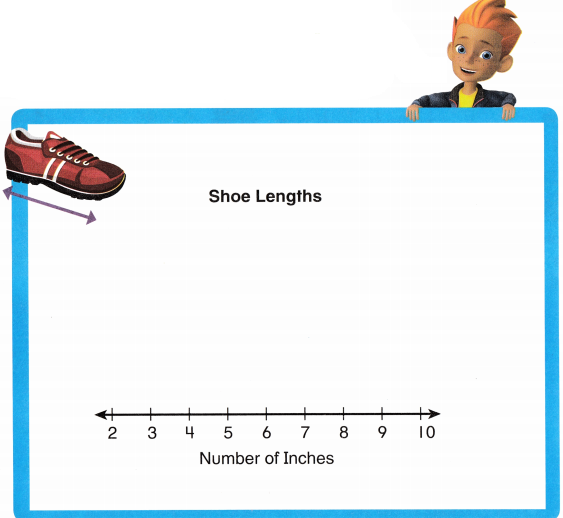
I can … measure the lengths of objects, then make a line plot to organize the data.
Visual Learning Bridge
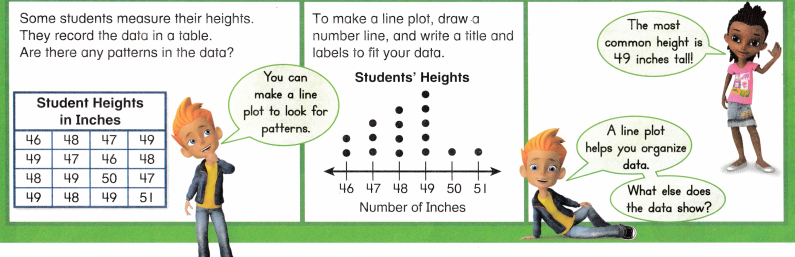
Convince Me! In the example above, how many students measured their height? Tell how you know.
Guided Practice
Use the table to make a line plot. Then use the line plot to answer each question.
Question 1.
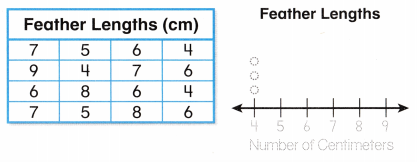
Question 2.
What is the most common feather length? _______ xm
Answer:
6 cm
Question 3.
Why does the number line use the numbers 4 through 9?
Answer:
Independent Practice
Collect data and use the data to complete the line plot. Then use the line plot to solve the problems.
Question 4.
Measure the length of your pencil in centimeters. Collect pencil-length data from your classmates. Make a line plot with the data.
Title: __________
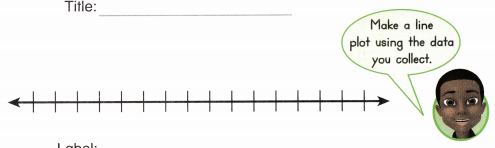
Label: ________
Answer: length of the pencil date from classmates is 4, 6, 7, 8.
Question 5.
What is the length of the longest pencil?
Answer: The length of the longest pencil is 8 inches.
Question 6.
What is the sum of the lengths of the shortest and longest pencils?
Answer:
Given that;
The length of the shortest pencil is 4 inches
length of the longest pencil is 8 inches
The sum of the longest and shortest pencil is 8 + 4 = 12.
Question 7.
What is the difference in lengths between the shortest and longest pencils?
Answer:
Given that;
The length of the shortest pencil is 4 inches.
The length of the longest pencil is 8
The difference between the shortest and longest pencil is 8 – 4 = 4.
Question 8.
What is the most common pencil length?
Answer: The most common pencil length is 6 inches.
Question 9.
Vocabulary Use these words to complete the sentences.
longest
line plot
order
A ________ can help you see the data in __________.
A line plot can show the lengths of the shortest and _________ objects.
Answer:
A line plot can help you see the data in order.
A line plot can show the lengths of the shortest and longest objects.
Problem Solving
Model Use the data in the table to complete the line plot. Then use the line plot to solve the problems.
Question 10.
Answer:
Question 11.
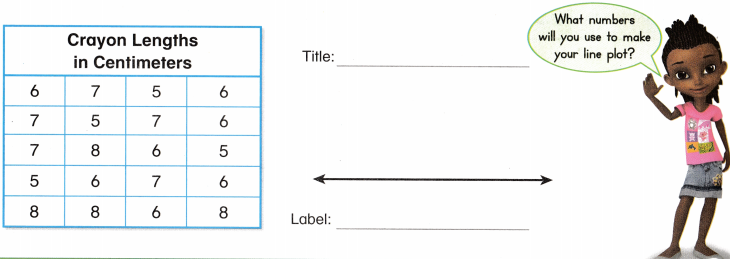
Higher Order Thinking Measure the length of one of your crayons in centimeters, 5 different times. Make a line plot of the data on a separate sheet of paper. Did you get the same measurement each time? Explain.
Answer:
Question 12.
Assessment Practice Measure the length of the blue crayon to the nearest centimeter. Write the length below.

_______________
Then record your measurement on the line plot above that you made in Item 10.
Answer:
Lesson 15.3 Bar Graphs
Solve & Share
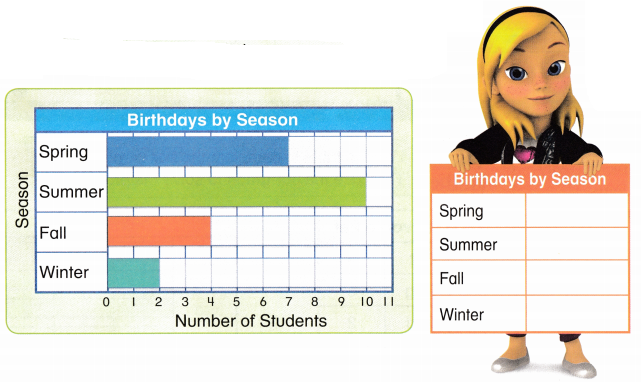
The graph shows the number of birthdays in each season for a class. Use the graph to write the number of birthdays in the table. How many more birthdays are celebrated during spring, fall, and winter than during summer? Be ready to explain how you know.
I can … draw bar graphs and use them to solve problems.
Visual Learning Bridge
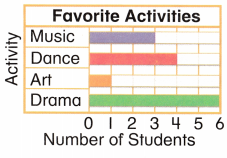
Convince Me! Which activity did the most students choose? Explain how you know.
Guided Practice
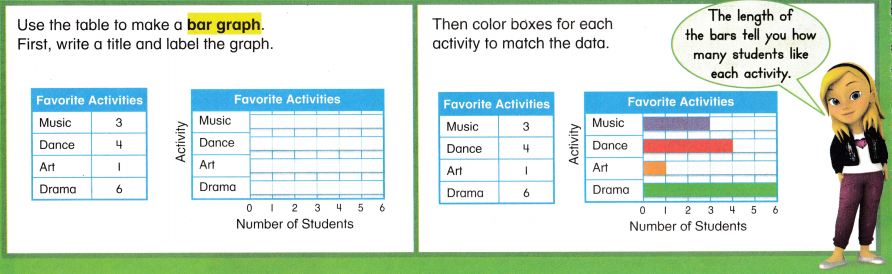
Use the table to complete the bar graph. Then use the bar graph to solve the problems.
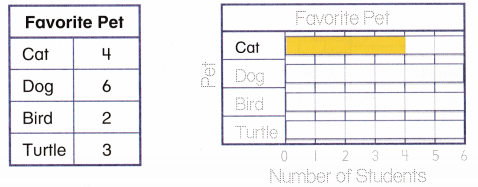
Question 1.
How many students chose cat? ________
Answer:
4 students choose a cat.
Question 2.
How many students chose bird or dog? _______
Answer:
6 students choose a dog.
2 students choose a bird.
Independent Practice
Use the bar graph to solve the problems.
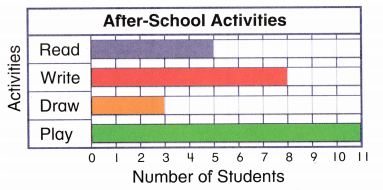
Question 3.
How many students write after school?
Answer:
8 students write after school.
Question 4.
How many fewer students draw than write after school?
________ fewer students
Answer:
Students draw after school = 3
Students write after school = 8
Fewer students draw than write after school = 8 – 3 = 5
Question 5.
Which activity do the fewest students do after school?
Answer:
The fewest students do after school is writing activity.
Question 6.
How many students read or draw after school?
Answer:
Students read after school = 5
Students write after school = 8
Students read and write after school = 13
Question 7.
Which activity do the most students do after school?
Answer:
Most students do school in play activities.
Question 8.
How many more students play than read after school?
__________ more students
Answer:
Students play activity after the school = 11
Students read activity after the school = 5
Students play than read after school = 11 – 5 = 6 students
Question 9.
Higher Order Thinking How would the graph be different if 2 students changed their after-school activity from play to read?
Answer:
Problem Solving
Solve the problems below.
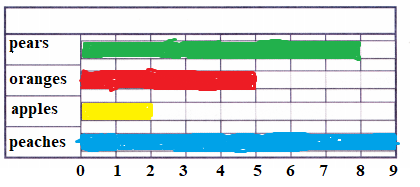
Question 10.
Model Wanda goes to the farm. She buys 8 pears, 5 oranges, 2 apples, and 9 peaches.
Use this data to make a bar graph.
Answer:
Question 11.
Higher Order Thinking Look at the graph you made in Item 10. How would the graph change if Wanda returns 3 of the pears that she buys?
Answer:
Question 12.
Assessment Practice Look at the bar graph you made in Item 10. Which are correct? Choose all that apply.
☐ Wanda buys the same number of pears and peaches.
☐ Wanda buys 3 more oranges than apples.
☐ Wanda buys 24 pieces of fruit in all.
☐ Wanda buys 3 fewer oranges than pears.
Answer:
Lesson 15.4 Picture Graphs
Solve & Share
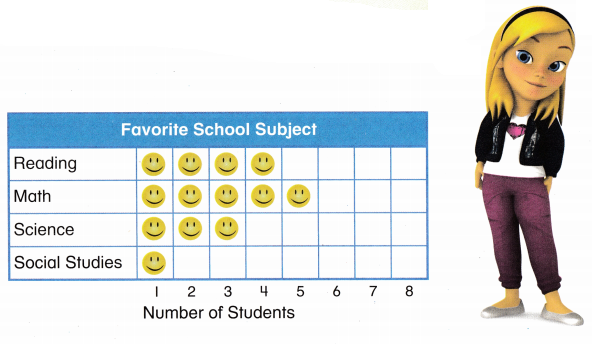
The picture graph shows the favorite subjects of a class. Draw a smiley face on the graph to show your favorite subject. Then interview two classmates and add their data. How many students responded to the survey? Which subject do most students like best? How many students like math or science best?
I can … draw picture graphs and use them to solve problems.
Visual Learning Bridge
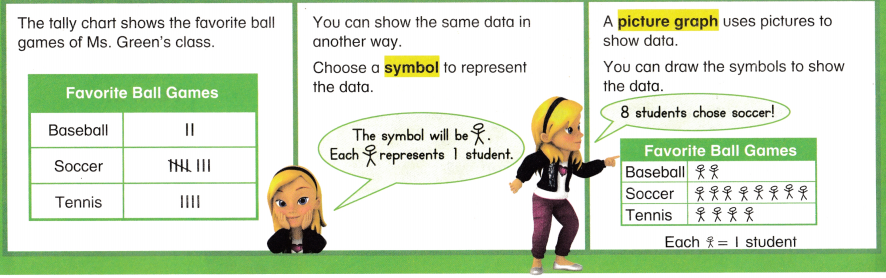
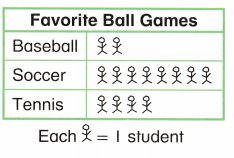
Convince Me! How are the tally chart and the picture graph for the favorite ball games of Ms. Green’s class alike?
Guided Practice
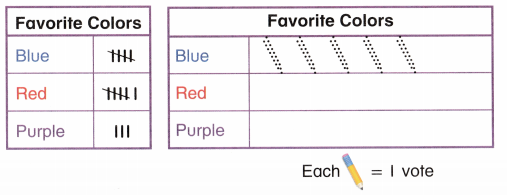
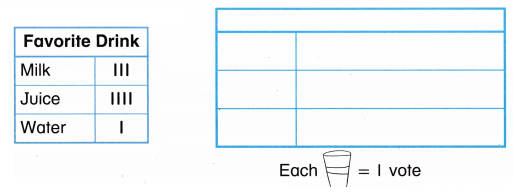
Use the tally chart to complete the picture graph. Then use the picture graph to solve the problems.
Question 1.
How many students like blue or red best? _______
Answer:
11
Question 2.
Which color is the favorite of most students? ________
Answer:
The blue color is the favorite of most students.
Independent Practice
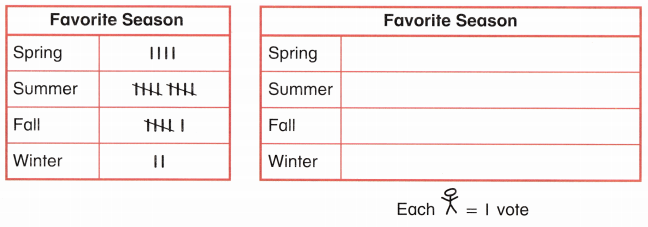
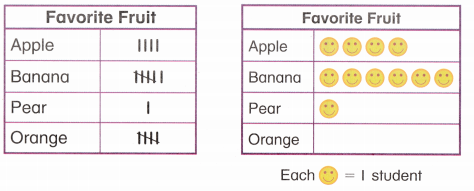
Use the tally chart to complete the picture graph. Then use the picture graph to solve the problems.
Question 3.
Answer:
Question 4.
How many students like fall best?
Answer:
6 students like fall best.
Question 5.
Which season do exactly 4 students like best?
Answer:
Spring season do exactly 4 students like best.
Question 6.
Which season do the fewest students like?
Answer:
Winter season do the fewest students like.
Question 7.
How many fewer students voted for winter than for summer?
Answer:
Students voted for winter is 2
Students voted for summer is 10
Fewer students voted for winter than summer is 10 – 2 = 8.
Question 8.
How many more students voted for summer than for spring and winter combined?
__________ more students
Answer:
Students voted for summer is 10
Students voted for spring is 4
Students voted for winter is 2
Students voted for winter and spring combined is 4 + 2 = 6
Students voted for summer more than winter and spring is 10 – 6 = 4
Question 9.
How many students like the season with the most votes?
Answer:
Students like the season with the most votes are the summer season.
Question 10.
Higher Order Thinking Look at the picture graph above. How would the graph change if 2 students changed their votes from summer to fall?
Answer:
Problem Solving
Use the tally chart to complete the picture graph. Use the picture graph to solve the problems.
Question 11.
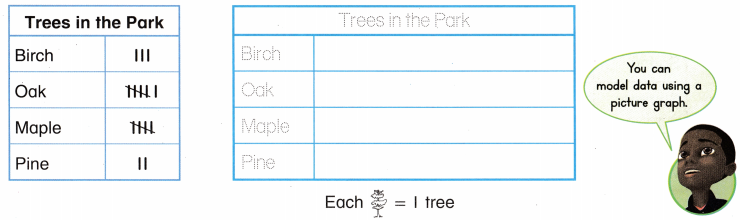
Model Bob made a tally chart to show the trees in a park.
Answer:
Question 12.
en Vision® STEM Birch, oak, maple, and pine trees are common in North America. Which type of tree is most common in the park?
Answer:
Question 13.
Higher Order Thinking How many birch and maple trees are there in all?
Answer:
Birch trees in the park = 3
Maple tree in the park = 4
Birch and maple trees in all are 7.
Question 14.
Assessment Practice Draw a picture graph to show the data in the table.
Answer:
Lesson 15.5 Draw Conclusions from Graphs
Solve & Share
7 students voted for Turtle as their favorite pond animal. 10 students voted for Frog. 4 students voted for Fish. Make a picture graph to show the data. Write two things you notice about the data.
I can .. draw conclusions from graphs.

1. __________________
2. __________________
Visual Learning Bridge
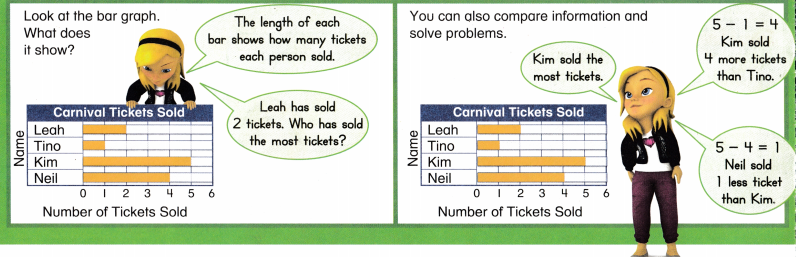
Convince Me! Look at the graph above. How many tickets did Kim and Neil sell in all? How do you know?
Guided Practice
Use the bar graph to solve the problems.
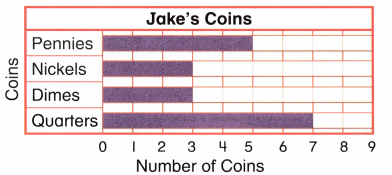
Question 1.
How many pennies does Jake have? ________
Answer:
Jake has 5 pennies.
Question 2.
Jake spends 3 of his quarters. How many does he have left?
Answer:
Total quarters at Jake = 7
Jake spends 3 of his quarters
He have left = 7 – 3 = 4
Independent Practice
Use the bar graph to solve the problems.
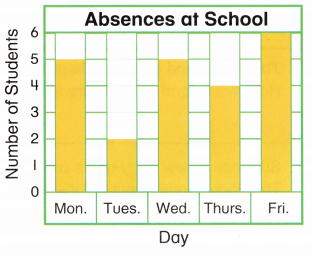
Question 3.
How many absences were there in all on Tuesday and Thursday?
Answer:
Total students absences in Tuesday = 2
Total students absences in Thursday = 4
Total students absences in Tuesday and Thursday = 2 + 4 = 6 students.
Question 4.
Were fewer students absent on Monday or Friday? How many fewer?
Answer:
Total students absent on Monday = 5
Total students absent on Friday = 6
1 Fewer student is absent on Monday
Question 5.
Three of the students absent on Friday were boys. How many girls were absent on Friday?
Answer:
Given that,
Total students absent on Friday = 6
From 6 students 3 are boys = 6 – 3 = 3
3 girls are absent on Friday.
Question 6.
On which two days were the same number of students absent?
Answer:
No two days were the same number of students absent.
Question 7.
Were more students absent on Wednesday or Thursday? How many more?
Answer:
Given that,
Total number of students absent on Wednesday = 5
Total number of students absent on Thursday = 4
More students are absent on Wednesday than Thursday
1 student is more absent on Wednesday.
Question 8.
Higher Order Thinking The graph shows the number of absences last week. This week, there are 19 absences. Compare the number of absences this week to the number of absences last week.
Answer:
Problem Solving
Use the bar graph to solve each problem.
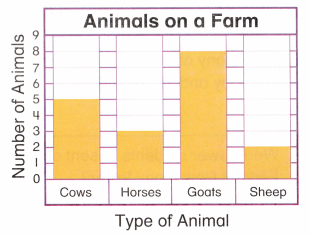
Question 9.
Make Sense Complete each sentence.
The farm has ________ Cows and ________ horses.
The farm has ________ goats and ________ sheep.
Answer:
The farm has 5 cows and 3 horses
The farm has 8 goats and 2 sheeps
Question 10.
The sheep and goats are kept in the same pen. How many farm animals are in that pen?
Answer:
Given that,
Sheep and goats are kept in the same pen.
Total number of sheep = 2
Total number of goats = 8
Total number of farm animals are in that pen = 8 + 2 = 10
Question 11.
Suppose 3 new baby goats are born. Then how many goats will the farmer have?
Answer:
Total number of goats = 8
3 new baby goats are born
Total number of goats at the farmer = 8 + 3 = 11 goats
Question 12.
How many fewer horses than cows are on the farm?
_________ fewer horses
Answer:
Total number of horses = 3
Total number of cows = 5
2 fewer horses than cows are on the farm.
Question 13.
Write the order of animals on the farm from the greatest number to the least number.
Answer:
Number of goats = 8
Number of cows = 5
Number of horses = 3
Number of sheep = 2
Question 14.
Higher Order Thinking Do you think the bars on a bar graph should all be the same color? Explain.
Answer:
No, the bars on a bar graph have different colours because to show the difference between the given data.
Question 15.
Assessment Practice The farmer wants to buy some sheep. He wants to have as many sheep as cows. How many more sheep should the farmer buy?
_________ more sheep
Answer:
Lesson 15.6 Problem Solving
Reasoning
Solve & Share
Make a picture graph to show how many connecting cubes, counters, and ones cubes you have. Then write and solve a problem about your data.
I can … reason about data in bar graphs and picture graphs to write and solve problems.
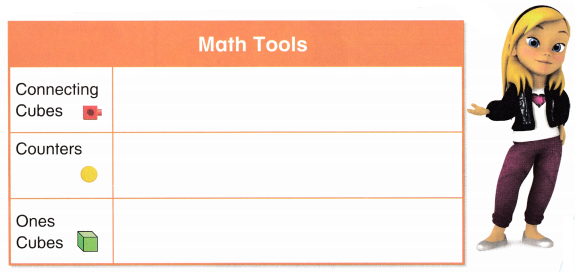
Each = 1 math tool
Thinking Habits What do the symbols mean? How are the numbers in the problem related?
Visual Learning Bridge
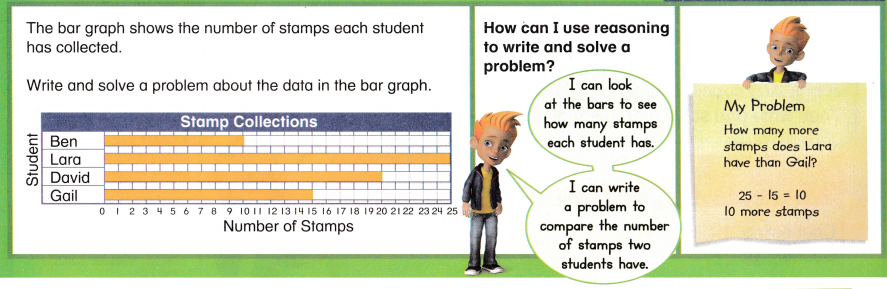
Convince Me! Use reasoning to write your own problem about the data in the graph. Then solve it.
Guided Practice
Use the bar graph to write and solve problems.
Question 1.
Answer:
Question 2.
_____________
_____________
________ ![]() _________ = ________
_________ = ________
Answer:
Independent Practice
Use the bar graph to write and solve problems.
Question 3.
_____________
_____________
________ ![]() _________ = ________
_________ = ________
_____________
_____________
Answer:
Question 4.
_____________
_____________
________ ![]() _________ = ________
_________ = ________
_____________
_____________
Answer:
Problem Solving
Performance Task
Vacation Time! The picture graph shows votes for favorite vacation spots. Each student voted only once. Which vacation spot has the same number of votes as two other vacation spots combined?
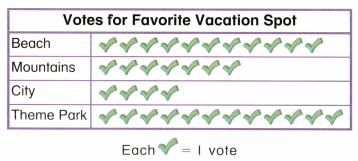
Question 5.
Explain Solve the problem above and explain your reasoning.
Answer:
Question 6.
Make Sense How many students voted in all? Tell how you know.
Answer:
Question 7.
Reasoning Write your own problem about the data in the graph. Then solve it.
_____________
_____________
________ ![]() _________ = ________
_________ = ________
_____________
_____________
Answer:
Topic 15 Fluency Practice
Find a Match
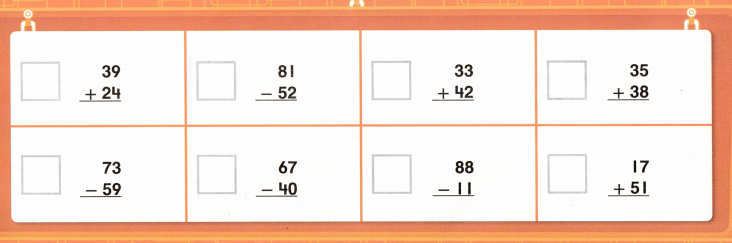
Find a partner. Point to a clue. Read the clue. Look below the clues to find a match. Write the clue letter in the box next to the match. Find a match for every clue.
I can … add and subtract within 100.
Clues
A. The difference is less than 16.
B. The sum equals 43 + 25.
F The sum equals 75.
C. The difference equals 75 – 46.
D. The sum equals 53 + 20.
E. The difference equals 96 – 19.
G. The sum is between 60 and 65.
H. The difference is between 25 and 28.
Topic 15 Vocabulary Review
Understand Vocabulary
Label each data display. Write line plot, bar graph, or picture graph.
Word List
• bar graph
• data
• line plot
• picture graph
• symbol
Question 1.
Answer:
Question 2.
Answer:
Question 3.
Answer:
Use Vocabulary in Writing
Question 4.
Look at the graph in Item 2. Use words to tell how to find which ball game is the most popular. Use terms from the Word List.
Answer:
Topic 15 Reteaching
Set A
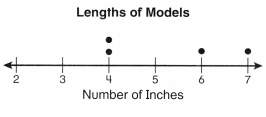
Line plots show and organize data. Use an inch ruler. Measure the length of the toy car. Then record the measurement in the table.
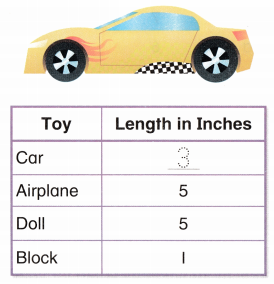
Place a dot over the number that shows the length of each toy.
Complete the table and show the data on a line plot.
Question 1.
Use an inch ruler. Measure the length of the pencil. Then record the measurement in the table.
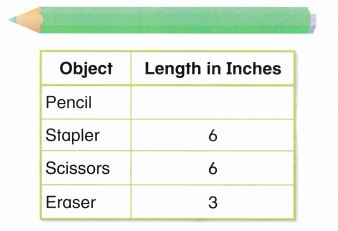
Answer:
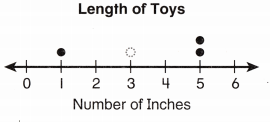
Question 2.
Make a line plot to show each length in the table.
Answer:
Set B
You can make a bar graph to show the data in a table.
Students voted for their favorite nut. The table shows the number of votes.
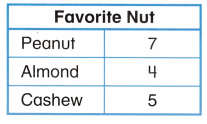
Color one space for each vote in the bar graph. Then use the graph to solve the problem.
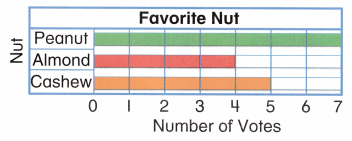
How many students voted?
16
Use the table to complete the bar graph. Then solve each problem.
Question 3.
Answer:
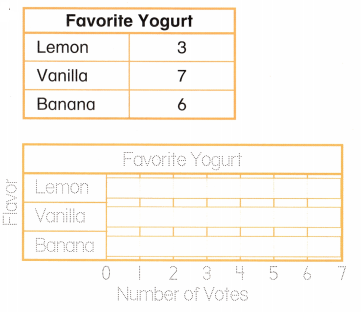
Question 4.
How many more students voted for vanilla than banana? ________
Answer:
Given that,
Students voted for vanilla = 7
Students voted for banana = 6
Students voted for vanilla than banana is 1.
Question 5.
How many fewer students voted for lemon than vanilla? _________
Answer:
Given that,
Students voted for lemon = 3
Students voted for vanilla = 7
Fewer students voted for lemon than Vanilla is 7 – 3 = 4
4 students voted for lemon than Vanilla.
Set C
A picture graph uses pictures or symbols to show data.
The tally chart shows votes for favorite sea animals.
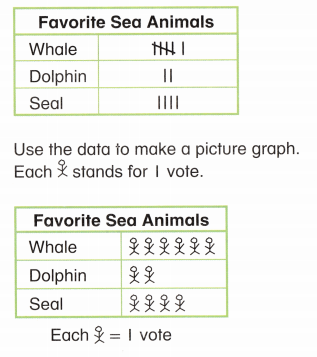
Which sea animal has the fewest votes?
![]()
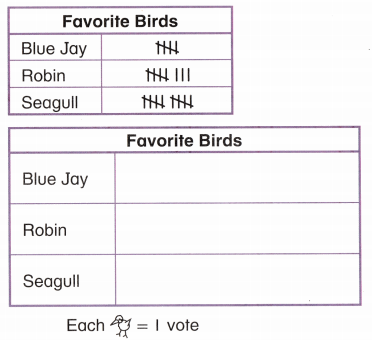
Use the tally chart to complete the picture graph. Then solve each problem.
Question 6.
Answer:
Question 7.
How many votes did seagull get?
Answer:
10 votes did seagull get.
Question 8.
Which bird had the fewest votes?
Answer:
Blue Jay bird had the fewest votes.
Set D
Thinking Habits
Reasoning
What do the symbols mean?
How are the numbers in the problem related? How can I write a word problem using the information that is given? How do the numbers in my problem relate to each other? How can I use a word problem to show what an equation means?
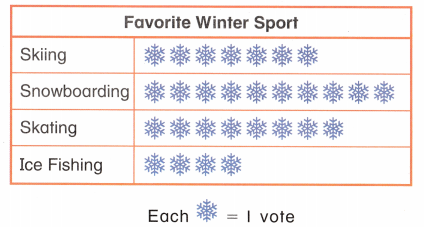
Use the picture graph to solve each problem. Each student voted once.
Question 9.
How many fewer students chose ice fishing than snowboarding?
Answer:
given that;
students who chose ice fishing is 4
students who chose snowboarding is 10
students chose ice fishing than snowboarding is 10 – 4 = 6
Question 10.
Write and solve your own problem about the data.
______________
______________
____ ![]() ______ = _________
______ = _________
______________
Answer:
Topic 15 Assessment Practice
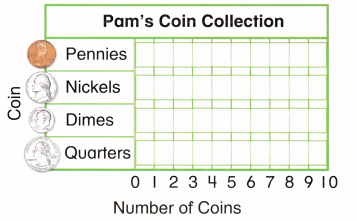
Question 1.
Pam has 5 pennies, 2 nickels, 8 dimes, and 9 quarters. Show this data in the bar graph below. Draw the bars.
Answer:
Question 2.
Use the bar graph you made above. Pam spends 5 of her dimes to buy an apple. Now how many dimes does Pam have left?
A. 13
B. 5
C. 3
D. 0
Answer:
Question 3.
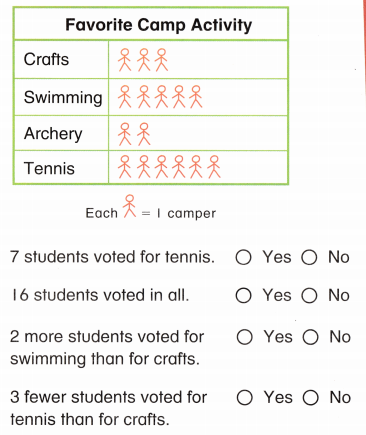
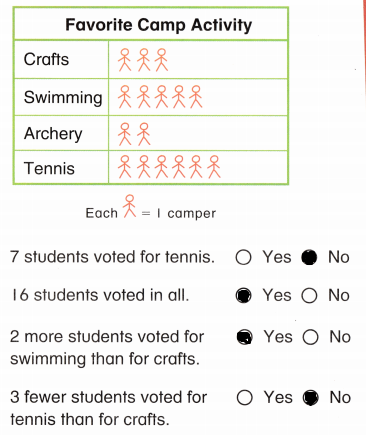
Is each sentence about the picture graph correct? Choose Yes or No.
Answer:
Question 4.
How many more tickets did Kendra sell than Leon?
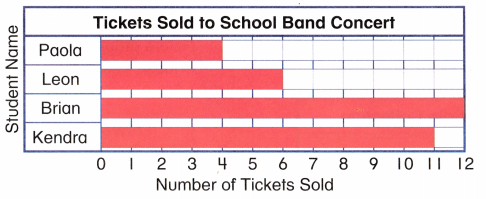
A. 5
B. 6
C. 11
D. 17
Answer:
5 more tickets did kendra band concert
Question 5
Complete the table and the line plot.
A. Use a centimeter ruler. Measure the length of the crayon to the nearest centimeter. Write the length in the table below.
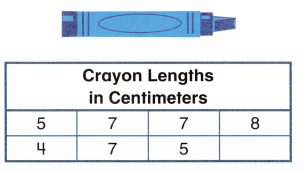
Answer:
B. Use the data in the table to complete the line plot.

What is the difference in length between the shortest and longest crayon?
Answer:
The shortest length of the crayon is 4
The longest length of the crayon is 8
The difference between the shortest and longest crayon is 8 – 4 = 4.
Question 6.
Scott is making a picture graph from the data in the tally chart.
How many symbols should he draw in the bottom row?
A. 3
B. 4
C. 5
D. 6
Answer:
Question 7.
Mary gets new stamps every month. The bar graph shows the number of stamps she collects each month.
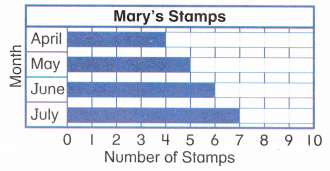
Which statements are true? Choose all that apply.
☐ Mary collects I more stamp in May than she does in April.
☐ Mary collects 2 fewer stamps in June than she does in July.
☐ Mary collects a total of |stamps in May and June.
☐ Mary collects one additional stamp each month from May to July.
☐ Mary collects the most stamps in June.
Answer:
the true statements are
Mary collects I more stamp in May than she does in April.
Mary collects one additional stamp each month from May to July.
Mary collects one additional stamp each month from May to July.
Question 8.
Use the tally chart to complete the picture graph. Then use the picture graph to solve the problems.
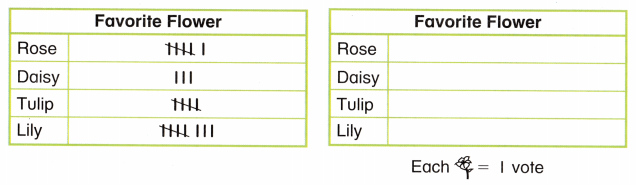
How many students voted for Lily? _________
Which flower is the least favorite? _________
Answer:
8 students voted for Lily.
Daisy is the least favorite flower.
Question 9.
Use the line plot and the numbers on the cards to complete each sentence.
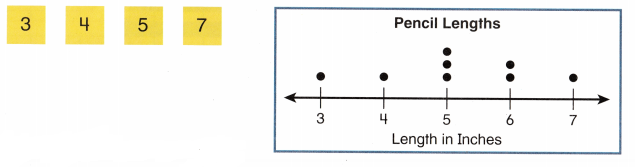
3 pencils are ________ inches long.
The longest pencil is ________ inches long.
The shortest pencil is ________ inches long.
The difference between the shortest and longest pencil is _________ inches.
Answer:3 pencils are 1 inch long.
The longest pencil is 3 inches long.
The shortest pencil is 1 inch long.
The difference between the shortest and longest pencil is 2 inches
Topic 15 Performance Task
School Surveys Some students asked their classmates different questions.
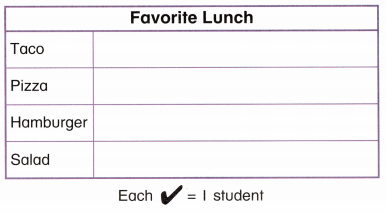
George asked his classmates to vote for their favorite lunch. This table shows the results.
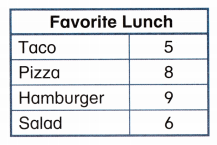
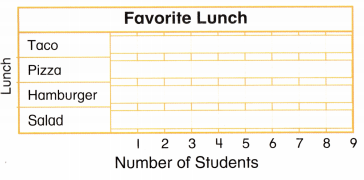
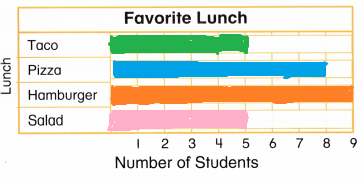
Question 1.
Use the table to complete the bar graph.
Answer:
Question 2.
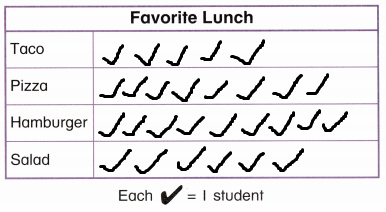
Use the Favorite Lunch table to complete the picture graph.
Answer:
Question 3.
Use the graphs you made to answer these questions.
How many students chose salad as their favorite lunch? _________
How many fewer students chose taco than hamburger? __________ fewer students
How would the bar graph change if two more students chose taco?
Answer:
Question 4.
Write and solve a math story about the Favorite Lunch graphs you made.
Part A
Use the bar graph or the picture graph about favorite lunches to write a math story problem. The problem should include addition or subtraction.
Answer:
Part B
Solve your math story problem. Explain how you solved the problem.
Answer:
Question 5.
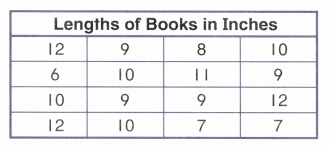
Gina asked her classmates to measure the length of their favorite storybook in inches. She recorded their measurements in this table.
Part A
Use the table to make a line plot.
Answer:
Part B What is the difference in length between the longest and shortest books?
________ inches
Answer:
Given that,
The length of the longest pencil is 12 inches
The length of the shortest book is 7 inches
The difference between longest book and shortest book = 12 – 7 = 5 inches