Practice with the help of enVision Math Common Core Grade 6 Answer Key Topic 8 Display, Describe and Summarize Data regularly and improve your accuracy in solving questions.
Envision Math Common Core 6th Grade Answers Key Topic 8 Display, Describe, And Summarize Data
Topic 8 Essential Question
How can data be described by a single number? How can tables and graphs be used to represent data and answer questions?
3-ACT MATH

Vocal Range
Have you ever disagreed with the judge on a reality TV show? Reality TV competitions rely on the different opinions of the judges to make the show more exciting. There are lots of factors to consider when comparing two contestants on a show. Think about this during the 3-Act Mathematical Modeling lesson.

Topic 8 enVision STEM Project
Did You Know?
Earthquakes are caused by the sudden release of energy in the Earth’s crust when friction between tectonic plates causes rocks to break along fault lines.
RING OF FIRE
PACIFIC OCEAN
Nearly 80% of Earth’s largest earthquakes occur along the “Ring of Fire.”
Many tectonic plates meet in this horseshoeshaped region around the Pacific Ocean.


The shape of a pagoda is known for resisting damage from earthquakes.

Your Task: Shake It Up
Engineers design sturdy bridges, buildings, dams and other structures that can withstand earthquakes. They also devise detection devices to predict earthquakes. You and your classmates will gather and display data about earthquake frequency and magnitude. You will analyze the data and determine what constraints engineers must consider when designing roadways, bridges, homes, and other structures.

Topic 8 Get Ready!
Review What You Know!
Vocabulary
Choose the best term from the box to complete each sentence.
- bar graph
- data
- dot plot
- tally chart
Question 1.
_______ are pieces of gathered information.
Answer:
Data are pieces of gathered information.
Explanation:
In the above-given question,
given that,
data are pieces of gathered information.
for example:
Question 2.
Display data as marks above a number line in a _________.
Answer:
Display data as marks above a number line in a line plot.
Explanation:
In the above-given question,
given that,
Display data as marks above a number line in a line plot.
for example:
negative integers on the left side in a number line.
positive integers on the right side in a number line.
Question 3.
Use the lengths of bars to show and compare data in a __________.
Answer:
Use the lengths of bars to show and compare data in a bar chart.
Explanation:
In the above-given question,
given that,
use the lengths of bars to show and compare data in a bar chart.
for example:
the student marks are given on the bar graph.
the students on the x-axis.
the marks on the y-axis.
scale: 1 unit = 5 marks.
Summarize Data
Use the number of text messages Henry sent each day: 6, 12, 2, 6, 3, 4, 2, 5, 6.
Question 4.
What is the least value?
Answer:
The least value is 2.
Explanation:
In the above-given question,
given that,
Henry sent each day: 6, 12, 2, 6, 3, 4, 2, 5, 6.
from the given data,
the least value is 2.
there are 2 two’s in the data.
Question 5.
What is the greatest value?
Answer:
The greatest value is 12.
Explanation:
In the above-given question,
given that,
Henry sent each day: 6, 12, 2, 6, 3, 4, 2, 5, 6.
from the given data,
the greatest value is 12.
there is one 12 in the data.
Question 6.
What numbers are repeated?
Answer:
6 and 2 are repeating.
Explanation:
In the above-given question,
given that,
Henry sent each day: 6, 12, 2, 6, 3, 4, 2, 5, 6.
from the given data,
6 is repeating 3 times.
2 is repeating 2 times.
6 and 2 are repeating.
Question 7.
How many text messages did Henry send in all?
Answer:
The number of text messages did Henry send in all = 9.
Explanation:
In the above-given question,
given that,
Henry sent each day: 6, 12, 2, 6, 3, 4, 2, 5, 6.
from the given data,
the number of text messages did Henry send in all = 9.
among those numbers 6 and 2 are repeating.
Display Data
Question 8.
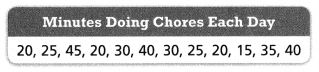
The table shows the time students spend doing chores each day. Draw a dot plot to show the data.
Answer:
20 is repeating 3 times.
25 is repeating 2 times.
30 is repeating 2 times.
40 is repeating 2 times.
Explanation:
In the above-given question,
given that,
the table shows the time students spend doing chores each day.
minutes doing chores each day.
20, 25, 45, 20, 30, 40, 30, 25, 20, 15, 35, 40.
20 is repeating 3 times.
25 is repeating 2 times.
30 is repeating 2 times.
40 is repeating 2 times.
Analyze Data
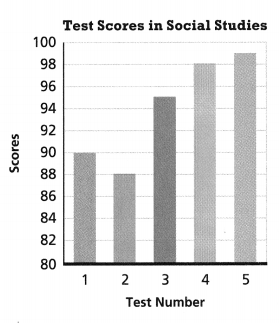
Use the graph to answer the questions about a student’s test performance.
Question 9.
How many more points were earned on Test 3 than on Test 1?
Answer:
The more points that were earned on Test 3 than on Test 1 is 5.
Explanation:
In the above-given question,
given that,
the test score in the social studies are given.
the test number is on the x-axis.
the scores are on the y-axis.
test 1 the number of points is 90.
test 3 the number of points is 95.
95 – 90 = 5.
so the more points that were earned on test 3 than on test 1 is 5.
Question 10.
Which two tests have the least difference in score? What is the difference?
Answer:
The two tests that have the least difference in the score are Test 4 and Test 5.
Explanation:
In the above-given question,
given that,
the two tests that have the least difference in the score are Test 4 and Test 5.
on Test 4 the score is 98.
on test 5 the score is 99.
99 – 98 = 1.
so the two tests that have the least difference in the score are Test 4 and Test 5.
Question 11.
What is the greatest difference between two scores? How do you know?
Answer:
The greatest difference between the two scores is 11.
Explanation:
In the above-given question,
given that,
The greatest difference between the two scores is Test 2 and Test 5.
on Test 2 the score is 88.
on Test 5 the score is 99.
99 – 88 = 11.
so the greatest difference between the two scores is 11.
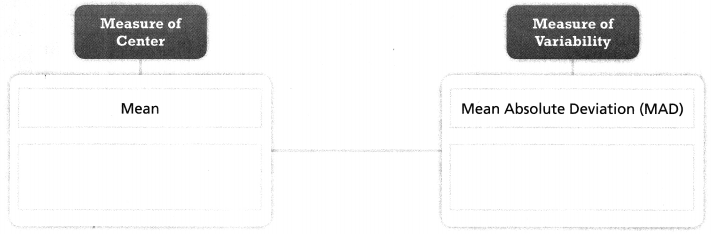
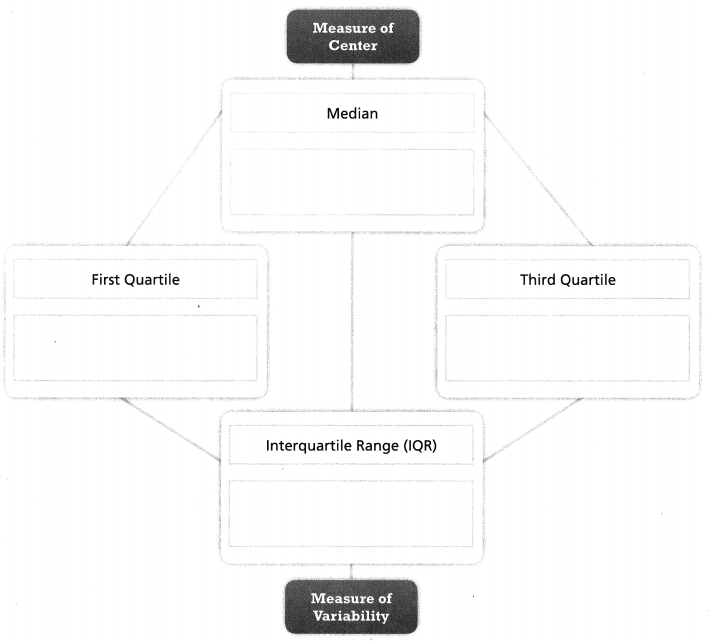
Language Development
Complete the graphic organizer. Write the definition of each measure in your own words.
Pick A Project
PROJECT 8A
If you recorded a video blog, what would it be about?
PROJECT: EXPLORE VIDEO BLOGS
PROJECT 8B
How many different breakfast cereals have you tasted?
PROJECT: INVESTIGATE CEREALS
PROJECT 8C
How far could you bike before needing to rest?
PROJECT: ANALYZE A TIME TRIAL

PROJECT 8D
If you could change something at your school, what would it be?
PROJECT: SURVEY YOUR SCHOOL

Lesson 8.1 Recognize Statistical Questions
Solve & Discuss It!
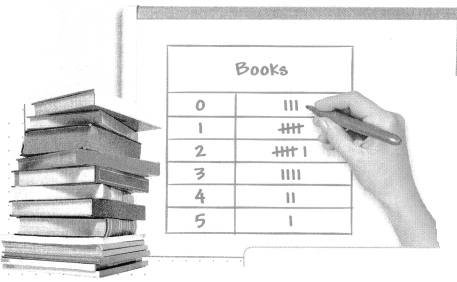
Ms. Jackson wrote a question on the board. Then she collected student responses to the question and recorded them in a tally chart. What question could she have asked? Is there more than one possible response to the question? Explain
I can… identify and write statistical questions.
Answer:
Yes, there is more than one possible response.
Explanation:
In the above-given question,
given that,
Ms. Jackson wrote a question on the board.
Then she collected student responses to the question and recorded them in a tally chart.
so there is more than one possible response.
Make Sense and Persevere
What other questions could you ask that would result in a variety of numerical answers?
Focus on math practices
Reasoning Suppose Ms. Jackson wants to know the amount of time her students spent outdoors the previous afternoon. What question might she ask each student to gather the data?
Answer:
the number of 0 books is 3.
the number of 2nd books is 1.
the number of 3 books is 3.
the number of 4 books is 2.
the number of 5 books is 1.
Explanation:
In the above-given question,
given that,
Ms. Jackson wants to know the amount of time her students spent outdoors the previous afternoon.
the number of 0 books is 3.
the number of 2nd books is 1.
the number of 3 books is 3.
the number of 4 books is 2.
the number of 5 books is 1.
Essential Question
How are statistical questions different from other questions?
Try It!
Is the question What was the high temperature on March 8 of last year? a statistical question? Explain.
Answer:
The high temperature on March 8 of last year is 90 degrees.
Explanation:
In the above-given question,
given that,
the high temperature on March 8 of last year is 90 degrees.
Convince Me! How could you change the question above to make it a statistical question?
Try It!
What is another statistical question Lucia might ask about the exercise the students in her class do each week?
Answer:
Try It!
How could Dante change his statistical question so that there would be more than two possible answers?
Answer:
KEY CONCEPT
To recognize and write statistical questions, determine whether the question has only one answer or several different answers. Statistical questions have a variety of different answers.
How many nickels are in a dollar? Not statistical
Which former U.S. president appears on a nickel? Not statistical
How many nickels do students carry in their backpacks? Statistical
Do You Understand?
Question 1.
Essential Question How are statistical questions different from other questions?
Answer:
Statistical questions are different from other questions.
Explanation:
In the above-given question,
given that,
statistical questions have a variety of different answers.
statistical questions example:
how many nickels do students carry in their backpacks?
non-statistical questions example:
How many nickels are in a dollar? Not statistical.
Question 2.
Generalize How does examining the answers to a question help you determine if the question is a statistical question?
Answer:
The number of nickels does students carry in their backpacks.
Explanation:
In the above-given question,
given that,
the number of nickels do students carry in their backpacks.
statistical questions example:
how many nickels do students carry in their backpacks?
Question 3.
Write a question about movies that your classmates saw last month. Is the question you wrote a statistical question? Justify your response.
Answer:
The movie that your classmates saw last month is vakelsaab.
Explanation:
In the above-given question,
given that,
the movie that your classmates saw last month is vakelsaab.
the question is a statistical question.
Question 4.
Choose which is a statistical question: What are the ages of the students in this class? or How many pennies equal 1 dollar? Explain.
Answer:
The ages of the students in this class = 12, 13, and 14.
Explanation:
In the above-given question,
given that,
the statistical questions are:
the ages of the students in this class.
the ages of the students in this class = 12, 13, and 14.
Do You Know How?
Question 5.
Determine which of the questions below are statistical questions.
a. In which months are the birthdays of everyone in your class?
Answer:
The birthday of everyone in your class is march, September, and August.
Explanation:
In the above-given question,
given that,
the birthdays of everyone in my class are:
one of a friend is in march.
one of my friends is in September.
my birthday is in august.
b. Does Sue wear glasses?
Answer:
Yes, sue wears glasses.
Explanation:
In the above-given question,
given that,
sue wears glasses.
sue buys 3 pairs of glasses.
so he will wear glasses.
c. Who is the current president of the United States?
Answer:
The current president of the united states is Joe Biden.
Explanation:
In the above-given question,
given that,
the current president of the united states is Joe Biden.
d. How tall are the students in Grade 6?
Answer:
The students in Grade 6 are 4 feet high.
Explanation:
In the above-given question,
given that,
the students in Grade 6 are 4 feet high.
some of the students in Grade 6 are also 3.8 feet high.
so the students in Grade 6 are 4 feet high.
e. What is the least populated state?
Answer:
The least populated state is
Explanation:
In the above-given question,
given that,
the least populated state is
the population in the state is
f. How many fish are in the pond?
Answer:
The number of fish is in the pond is 9.
Explanation:
In the above-given question,
given that,
in the pond, there are many numbers of fishes and also frogs.
the number of fish is in the pond is 9.
the number of frogs in the pond is 6.
Question 6.
Mr. Borden asked his students, How far from school do you live? Is his question a statistical question? Explain.
Answer:
Yes, it is a statistical question.
Explanation:
In the above-given question,
given that,
the far from school do i live is 3 km.
so it is a statistical question.
Question 7.
Mr. Borden also asked his students, How do you get to school each day? Is this question statistical? Explain.
Answer:
No, this is not a statistical question.
Explanation:
In the above-given question,
given that,
I will go to school each day by cycle.
I will go to school by either cycle or bike.
so it is not a statistical question.
Practice & Problem Solving
In 8 and 9, write a statistical question that you could ask to gather data on each topic.
Question 8.
Number of pets classmates own
Answer:
The number of pets classmates own is 4.
Explanation:
In the above-given question,
given that,
the number of pets classmates own.
the number of dogs is 4.
so the number of pets classmates own is 4.
Question 9.
Heights of different household plants

Answer:
The height of the plants is 2, 1, and 1/2 in.
Explanation:
In the above-given question,
given that,
there are 5 varieties of household plants.
the height of 2 plants is 2 in.
the height of the other 2 plants is 1 in.
the height of 1 plant is 1/2 inch.
Question 10.
Kim asked her classmates, How many siblings do you have? She collected the following responses: 0, 1, 2, 1, 2, 0, 3, 1, 0, 5, 5, 1, 3, 1, 0, 2, 4, 1, 3, 0. Make a dot plot to display the data.
Answer:
The number of siblings does Kim have = 6.
Explanation:
In the above-given question,
given that,
Kim asked her classmates.
she collected the responses 0,1, 2, 1, 2, 0, 3, 1, 0, 5, 5, 1, 3, 1, 0, 2, 4, 1, 3, 0.
the number of plots on 0 is 5.
the number of plots on 1 is 6.
the number of plots on 2 is 3.
the number of plots on 3 is 3.
the number of plots on 4 is 1.
the number of plots on 5 is 5.
so the number of siblings does Kim have = 6.
Question 11.
Sergei asked his classmates, Will you take Spanish or French next year? He collected these responses: 15 classmates chose Spanish and 13 chose French. Make a frequency table to display the data.
Answer:
The number of classmates who choose both languages is 28.
Explanation:
In the above-given question,
given that,
Sergei asked his classmates.
15 classmates chose Spanish and 13 chose French.
so the number of classmates who choose both languages is 28.
Question 12.
Is the following a statistical question? Explain. How many plays do students see in a year?
Answer:
The number of plays does students see in a year is 3.
Explanation:
In the above-given question,
given that,
the number of plays does students see in a year is 3.
the total number of students in a year is 6.
so the number of plays do students see in a year is 3.
Question 13.
Is the following a statistical question? Explain. How do shoppers in a town pay for groceries?
Answer:
In 14 and 15, use the dot plot at the right.
Question 14.
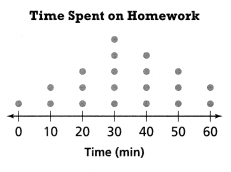
Make Sense and Persevere What statistical question could have been asked to collect the data shown in the dot plot?
Answer:
The time spent on 60 minutes is 2.
Explanation:
In the above-given question,
given that,
the time spent on Homework is given.
the time spent on 0 minutes is 1.
the time spent on 10 minutes is 2.
the time spent on 20 minutes is 3.
the time spent on 30 minutes is 5.
the time spent on 40 minutes is 4.
the time spent on 50 minutes is 3.
the time spent on 60 minutes is 2.
Question 15.
Higher Order Thinking If the data in the dot plot show how many minutes students spent on homework the previous night, how many hours in all did these students spend doing homework? Did a typical student from this group spend more or fewer than 20 minutes on homework?
Answer:
Explanation:
In the above-given question,
given that,
Question 16.
Vocabulary Wyatt says that a statistical question must have a numerical answer. Do you agree with Wyatt? Explain.
Answer:
Question 17.
Reasoning Ms. Miller asks parents, Do you support switching to a new lunch vendor for our school program? How many different responses could she get? Is this a statistical question?
Answer:
Assessment Practice
Question 18.
Ms. Williams asked each student in her class these two questions:
- How many digits are in a phone number, including the area code?
- In a typical week, on how many days do you spend some time watching television?
Which of the questions that Ms. Williams asked is a statistical question? Explain.
Answer:
How many digits are in a phone number, including the area code?
Explanation:
In the above-given question,
given that,
Ms. Williams asked is a statistical question?
there are 12 digits are in a phone number, including the area code.
so How many digits are in a phone number, including the area code.
Question 19.
Select all of the statistical questions.
☐ What is your favorite color?
☐ Does Carmen wear braces?
☐ How many books did you read last week?
☐ Which U.S. state has the largest land area?
☐ Should the basketball team purchase new uniforms?
Answer:
Options A and D are correct.
Explanation:
In the above-given question,
given that,
the questions satisfy the statistical questions.
what is your favorite color?
How many books did you read last week?
which U.S state has the largest land area.
so options A and D are correct.
Lesson 8.2 Summarize Data Using Mean, Median, Mode, and Range
Solve & Discuss It!
Eight students were surveyed about the number of hours they spend each week reading for fun. Order their responses from least to greatest values. What do you notice about the number of hours these students spent reading each week?
I can… identify the mean, median, mode, and range of a data set.

Look for Relationships
How does ordering the responses from least to greatest help you analyze the data set?
Focus on math practices
Critique Reasoning Jamal says that the middle value in a data set is the number that occurs most often. Evan disagrees. Why does Jamal say what he says and why does Evan disagree? Explain.
Essential Question
How can you use a single measure to describe a data set?
Try It!
The next week, Maria bowls a 151-point game. The other bowlers match their scores. What is the new mean final score for the team? Explain.
Answer:
Convince Me! How did the mean final score change from the Example to the Try It!?
Try It!
Nadia’s grades on four quizzes were 95, 75, 85, and 95. Find the mean, median, and mode for Nadia’s grades.
Answer:
Mean = 87.5.
median = 90.
mode = 95.
Explanation:
In the above-given question,
given that,
Nadia’s grades on four quizzes were 95, 75, 85, and 95.
the mean is sum/n.
mean = 87.5.
median = 75, 85, 95, 95.
median = 180/2.
median = 90.
mode = the number that appears the most.
mode = 95.
Try It!
Find the mean, median, mode, and range for the following set of data.
4, 6, 8, 3, 2, 1, 0, 12, 9
Answer:
Mean = 5, median = 2, mode = no, and range = 12.
Explanation:
In the above-given question,
given that,
the data is 4, 6, 8, 3, 2, 1, 0, 12, 9.
mean = sum/n.
mean = 4 + 6 + 8 + 3 + 2 + 1 + 0 + 12 + 9/9.
mean = 45/9.
mean = 5.
median = 2.
mode = no.
range = 12 – 0.
range = 12.
KEY CONCEPT
You can summarize a set of data using a measure of center, such as the mean, median, or mode, or a measure of variability, such as the range.
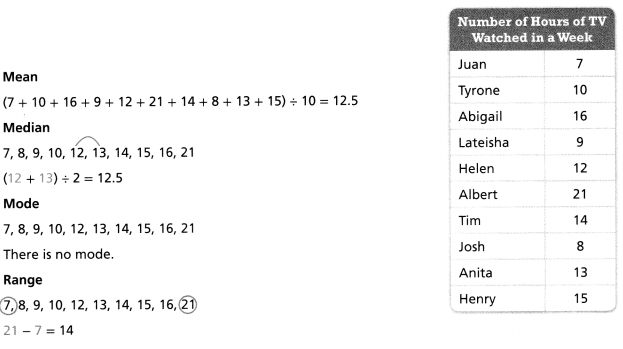
The average number of hours of TV watched each week is 12.5 hours. The range of hours watched is 14 hours.
Do You Understand?
Question 1.
Essential Question How can you use a single measure to describe a data set?
Answer:
Question 2.
Maddie scored 3 goals, 2 goals, and 4 goals during her last three soccer games. How can you find the mean, or average, number of goals Maddie scored?
Answer:
Mean = 3.
Explanation:
In the above-given question,
given that,
Maddie scored 3 goals, 2 goals, and 4 goals during her last three soccer games.
mean = 3 + 2 + 4/3.
mean = 9/3.
mean = 3.
Question 3.
Use Structure Why is it important to order the data when finding the median?
Answer:
median is the number that is the middle of the middle value.
Explanation:
In the above-given question,
given that,
median is the number that is the middle of the middle value.
for example:
11, 7, 11, 18, 9, 7, 6, 23, 7.
6, 7, 7, 7, 9, 11, 11, 18, 23.
median = 9.
Do You Know How?
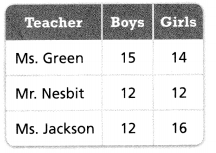
The table shows data about the students in three classes.
Question 4.
What is the mean number of boys in the three classes? What is the mean number of girls in the three classes?
Answer:
The mean number of girls in the three classes = 14.
Explanation:
In the above-given question,
given that,
the girls in the class are 14, 12, and 16.
mean = 14 + 12 + 16/3.
mean = 42/3.
mean = 14.
so the mean number of girls in the three classes = 14.
Question 5.
What is the mode of the number of girls in the three classes?
Answer:
The mode of the number of girls in three classes = no.
Explanation:
In the above-given question,
given that,
the girls in the class are 14, 12, and 16.
mode = no.
no number is repeating.
so the mode of the number of girls in three classes = 0.
Question 6.
What is the median number of students in the three classes?
Answer:
The median number of students in the three classes = 13.
Explanation:
In the above-given question,
given that,
the students in the class are 12, 15, 12, 14, 12, and 16.
median = 12, 12, 12, 14, 15, 16.
median = 26/2.
median = 13.
so the median number of students in the three classes = 13.
Practice & Problem Solving
In 7-10, use the data shown in the table to find each mean.
Question 7.
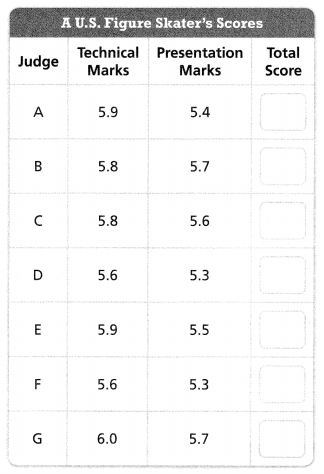
Technical marks from judges
Answer:
Technical marks from judges = 5.9, 5.8, 5.8, 5.6, 5.9, 5.6, 6.0.
Explanation:
In the above-given question,
given that,
the technical marks of A, B, C, D, E, F, G.
5.9, 5.8, 5.8, 5.6, 5.9, 5.6, 6.0.
so the technical marks from judges = 5.9, 5.8, 5.8, 5.6, 5.9, 5.6, 6.0.
Question 8.
Presentation marks from judges
Answer:
presentation marks from judges = 5.4, 5.7, 5.3, 5.6, 5.5, 5.3, 5.7.
Explanation:
In the above-given question,
given that,
the presentation marks of A, B, C, D, E, F, G.
5.4, 5.7, 5.3, 5.6, 5.5, 5.3, 5.7.
so the presentation marks from judges = 5.4, 5.7, 5.3, 5.6, 5.5, 5.3, 5.7.
Question 9.
Find the combined marks, or total score, awarded by each of the 7 judges. Record your answers in the table.
Answer:
The total score awarded by each of the 7 judges = 79.1.
Explanation:
In the above-given question,
given that,
the technical marks of A, B, C, D, E, F, G.
5.9, 5.8, 5.8, 5.6, 5.9, 5.6, 6.0.
the presentation marks of A, B, C, D, E, F, G.
5.4, 5.7, 5.3, 5.6, 5.5, 5.3, 5.7.
total score = 11.3, 11.5, 11.1, 11.2 , 11.4, 10.9, 11.7.
total score = 79.1.
Question 10.
What is the mean total score awarded by the judges?
Answer:
The mean total score awarded by the judges = 11.3.
Explanation:
In the above-given question,
given that,
the technical marks of A, B, C, D, E, F, G.
5.9, 5.8, 5.8, 5.6, 5.9, 5.6, 6.0.
the presentation marks of A, B, C, D, E, F, G.
5.4, 5.7, 5.3, 5.6, 5.5, 5.3, 5.7.
total score = 11.3, 11.5, 11.1, 11.2 , 11.4, 10.9, 11.7.
mean = 79.1/7.
mean = 11.3.
so the mean total score awarded by the judges = 11.3.
In 11-14, use the data in the table.
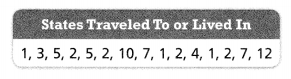
States Traveled to or Lived In
Question 11.
Order the data from least to greatest.
Answer:
The order from least to greatest = 1, 1, 1, 2, 2, 2, 2, 3, 4, 5, 5, 7, 7, 10, 12.
Explanation:
In the above-given question,
given that,
the states traveled to or lived in.
1, 3, 5, 2, 5, 2, 10, 7, 1, 2, 4, 1, 2, 7, 12.
the order from least to greatest is:
1, 1, 1, 2, 2, 2, 2, 3, 4, 5, 5, 7, 7, 10, 12.
so the order from least to greatest = 1, 1, 1, 2, 2, 2, 2, 3, 4, 5, 5, 7, 7, 10, 12.
Question 12.
What are the median, mode, and range of the data?
Answer:
The median, mode, and range = 4.2, 2, 11.
Explanation:
In the above-given question,
given that,
1, 1, 1, 2, 2, 2, 2, 3, 4, 5, 5, 7, 7, 10, 12.
mean = 64/15.
mean = 4.2.
mode = 2.
range = 12 – 1.
range = 11.
Question 13.
Use Structure The student who traveled to 3 states visited 3 new states during a vacation. Does increasing the 3 to 6 change the median? If so, how?
Answer:
median = 6.
Explanation:
In the above-given question,
given that,
The student who traveled to 3 states visited 3 new states during a vacation.
3 + 3 = 6.
6 – 3 = 3.
median = 6.
Question 14.
Look for Relationships Does increasing the 3 to 6 change the mode? If so, how?
Answer:
In 15-17, use the data table.
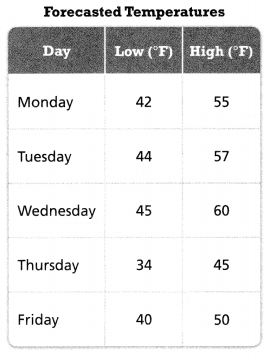
Question 15.
What is the average low temperature forecasted for the five days?
Answer:
The average low temperature forecasted for the five days = 40.75.
Explanation:
In the above-given question,
given that,
the average temperature on Monday is 42.
Tuesday is 44.
Wednesday is 45.
Thursday 34.
Friday is 40.
44 + 45 + 34 + 40 = 163/4.
average low temperature = 40.75.
Question 16.
What is the average high temperature forecasted for the five days?
Answer:
The average high temperature forecasted for the five days = 53.4.
Explanation:
In the above-given question,
given that,
the average high temperature on Monday is 55.
Tuesday is 57.
Wednesday is 60.
Thursday 45.
Friday is 50.
the average high temperature = 55 + 57 + 60 + 45 + 50.
average = 267/5.
average = 53.4.
Question 17.
The forecast for Wednesday is later changed to a high of 70°F. Without calculating the new mean, describe how this changes the mean high temperature for the 5 days.
Answer:
The high temperature for the 5 days = 14.
Explanation:
In the above-given question,
given that,
The forecast for Wednesday is later changed to a high of 70°F.
the mean high temperature for the 5 days.
mean = 70/5.
mean = 14.
Question 18.
Vocabulary What term is used to describe the difference between the greatest and the least values of a data set?
Answer:
The term is used to describe the difference between the greatest and the least values of a data set are range.
Explanation:
In the above-given question,
given that,
the term is used to describe the difference between the greatest and the least values of a data set are range.
for example:
11, 7, 11, 18, 9, 7, 6, 23, 7.
large = 23 and small = 6.
range = 23 – 6.
range = 17.
Question 19.
Critique Reasoning Lewis thinks that since the data 5, 0, 4, 0, 0 has a mode of 0, the data has no mode. Critique Lewis’s reasoning.
Answer:
Data has no mode.
Explanation:
In the above-given question,
given that,
the data is 5, 0, 4, 0, and 0.
mode = 0.
so the data has no mode.
Question 20.
Chester scored 84, 88, and 80 on his first 3 math tests. How can you find Chester’s mean, or average, score on these tests?
Answer:
The mean = 84.
Explanation:
In the above-given question,
given that,
Chester scored 84, 88, and 80 on his first 3 math tests.
mean = 84 + 88 + 80/3.
mean = 84.
Question 21.
Reasoning Use the information in Exercise 20. Suppose Chester scores a 90 on his next test. Without doing any calculations, will Chester’s mean score increase, decrease, or stay the same? Explain.
Answer:
Mean = 85.5.
Explanation:
In the above-given question,
given that,
Suppose Chester scores a 90 on his next test.
mean = 84 + 88 + 80 + 90/4.
mean = 342/4.
mean = 85.5.
Question 22.
On Monday, Jeremiah collects data on the number of cars that pass through an intersection each hour from 6 A.M. to 10 A.m. He records the following data: 15, 27, 37, 29, and 12. If Jeremiah removes the 12 from his data set, will the mean change? Explain.
Answer:
Yes, the mean change.
Explanation:
In the above-given question,
given that,
On Monday, Jeremiah collects data on the number of cars that pass through an intersection each hour from 6 A.M. to 10 A.m.
He records the following data: 15, 27, 37, 29, and 12.
15 + 27 + 37 + 29.
mean = 15 + 27 + 37 + 29/4.
mean = 86.25.
so the mean will change.
Question 23.
On Tuesday, Jeremiah finds the mean number of cars that pass through the same intersection from 6 A.m. to 10 A.M. was 22. Using the data from Exercise 22, how many fewer cars passed through the intersection on Tuesday?
Answer:
The fewer cars passed through the intersection on Tuesday = 30.
Explanation:
In the above-given question,
given that,
On Tuesday, Jeremiah finds the mean number of cars that pass through the same intersection from 6 A.m. to 10 A.M.
He records the following data: 15, 27, 37, 29, and 12.
15 + 27 + 37 + 29 + 12.
mean = 15 + 27 + 37 + 29 + 12/4.
mean = 30.
In 24-26, use the data table.
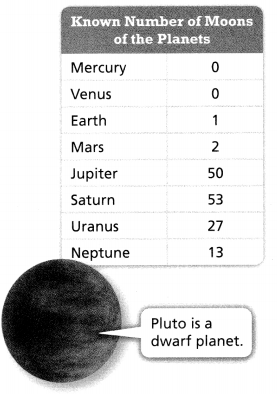
Question 24.
What are the median, mode, and range of these data?
Answer:
The mean, mode, and range = 18.25, 0, and 52.
Explanation:
In the above-given question,
given that,
Known numbers of the moons of the planets are given.
mercury – 0.
venus – 0.
Earth – 1.
Mars – 2.
Jupiter – 50.
Saturn = 53.
Uranus = 27.
Neptune = 13.
mean = 146/8.
mean = 18.25.
mode = 0.
range = 53 – 1.
range = 52.
Question 25.
What is the mean number of moons for the 8 planets, rounded to the nearest whole number?
Answer:
The mean number of moons for the 8 planets = 18.25.
Explanation:
In the above-given question,
given that,
Known numbers of the moons of the planets are given.
mercury – 0.
venus – 0.
Earth – 1.
Mars – 2.
Jupiter – 50.
Saturn = 53.
Uranus = 27.
Neptune = 13.
mean = 146/8.
mean = 18.25.
Question 26.
If you include Pluto’s moons in the data, the median is 5.
a. How many moons does Pluto have? Explain.
Answer:
The number of moons does pluto have = 0.
Explanation:
In the above-given question,
given that,
pluto is a dwarf planet.
there is no planets for pluto.
so the number of moons does pluto have = 0.
b. Would including Pluto affect the range of the data? Explain.
Answer:
Question 27.
Higher Order Thinking is the median always, sometimes, or never one of the data values? Explain.
Answer:
Question 28.
Critique Reasoning Maria says the mean of the scores 7, 8, 3, 0, 2 is 5, because she added the scores and divided by 4. Is she correct? Explain why or why not.
Answer:
Yes, mean is 5.
Explanation:
In the above-given question,
given that,
Maria says the mean of the scores 7, 8, 3, 0, 2 is 5, because she added the scores and divided by 4.
mean = 7 + 8 + 3 + 2 /4.
mean = 20/4.
mean = 5.
Assessment Practice
Question 29.
The cost of 8 different sets of golf clubs is shown in the data table. A new brand of golf clubs for $533 is now being sold at the shop. Which of the following statements about the data is true?
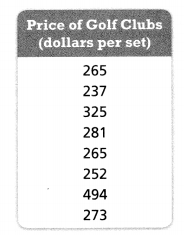
A. The mean cost will decrease.
B. The range of the costs will increase.
C. The mean cost will stay the same.
D. The range of the costs will stay the same.
Answer:
Option A, B, and D are correct.
Explanation:
In the above-given that,
given that,
The cost of 8 different sets of golf clubs is shown in the data table.
A new brand of golf clubs for $533 is now being sold at the shop.
so options A, B, and D are correct.
Lesson 8.3 Display Data in Box Plots
Solve & Discuss It!
To track how many raisins are needed for packaging, a quality control inspector at a food processing plant collected data for the number of raisins in small boxes. Describe the data, including minimum value, maximum value, and median. Then describe what you notice about the values between the minimum and the median, and between the median and maximum.
I can… make and interpret box plots.
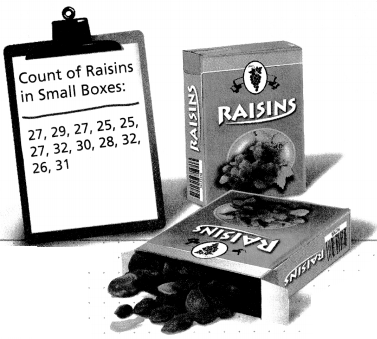
Reasoning
How can ordering the numbers of raisins in small boxes from least to greatest help you find the median?
Focus on math practices
Construct Arguments The median of the first half of the data is 26.5, and the median of the second half of the data is 30.5. Why would this information be helpful and what do those medians show? Explain.
Essential Question
Why is a box plot useful for representing certain types of data?
Try It!
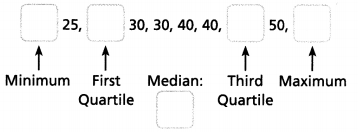
The lengths in inches of 11 fish that Helen caught last year are listed below.
7, 8, 12, 12, 12, 13, 14, 15, 16, 17, 22
Circle the first quartile, median, and third quartile.
Answer:
The length in inches of 11 fish that Helen caught last year is 13.4.
Explanation:
In the above-given question,
given that,
The length in inches of 11 fish that Helen caught last year is
mean = 7 + 8 + 12 + 12 + 12 + 13 + 14 + 15 + 16 + 17 + 22.
mean = 148/11.
mean = 13.4.
so the length in inches of 11 fish that Helen caught last year is 13.4.
Convince Me! How is the distribution of Helen’s data this year different from Helen’s data last year? Draw a box +HHH H HHHHHHHH plot of last year’s data and use it to support your answer.
Try It!
The ages of 12 volunteers participating in a beach clean-up are shown:
15, 27, 9, 15, 21, 9, 21, 9, 15, 21, 21, 24
Record the ages in a box plot.
Answer:
Mean = 17.25.
Explanation:
In the above-given question,
given that,
The ages of 12 volunteers participating in a beach clean-up are shown.
15, 27, 9, 15, 21, 9, 21, 9, 15, 21, 21, 24.
mean = 207/ 12.
mean = 17.25.
KEY CONCEPT
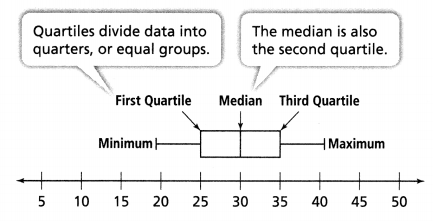
A box plot shows a distribution of data values on a number line. A box plot visually represents a data set divided into four equal parts.
Do You Understand?
Question 1.
Essential Question Why is a box plot useful for representing certain types of data?
Answer:
A box plot shows a distribution of data values on a number line.
A box plot visually represents a data set divided into four equal parts.
Explanation:
In the above-given question,
given that,
A box plot shows a distribution of data values on a number line.
A box plot visually represents a data set divided into four equal parts.
quartiles divide data into quarters or equal group.
median is also the second quartile.
quartile is divided into 3 parts.
Question 2.
What values are included inside the box of a box plot?
Answer:
A box plot shows a distribution of data values on a number line.
A box plot visually represents a data set divided into four equal parts.
Explanation:
In the above-given question,
given that,
A box plot shows a distribution of data values on a number line.
A box plot visually represents a data set divided into four equal parts.
quartiles divide data into quarters or equal group.
median is also the second quartile.
Question 3.
Critique Reasoning A box plot shows the distribution of the costs of used books. The box of the box plot starts at $2 and ends at $5. Alex says this means that about one-quarter of the books cost between $2 and $5. Is Alex correct? Explain.
Answer:
Yes, Alex is correct.
Explanation:
In the above-given question,
given that,
A box plot shows the distribution of the costs of used books.
The box of the box plot starts at $2 and ends at $5.
Alex says this means that about one-quarter of the books cost between $2 and $5.
$2 is on the first quartile.
$5 is on the third quartile.
so Alex is correct.
Do You Know How?
Sarah’s scores on tests were 79, 75, 82, 90, 73, 82, 78, 85, and 78. In 4-8, use the data.
Question 4.
What are the minimum and maximum test scores?
Answer:
The minimum and maximum test scores are 73 and 90.
Explanation:
In the above-given question,
given that,
Sarah’s scores on tests were 79, 75, 82, 90, 73, 82, 78, 85, and 78.
the minimum test score is 73.
the maximum test score is 90.
so the minimum and maximum test scores are 73 and 90.
Question 5.
Find the median.
Answer:
Median = 78.
Explanation:
In the above-given question,
given that,
the median is the number which is in the middle or the middle value.
Sarah’s scores on tests were 79, 75, 82, 90, 73, 82, 78, 85, and 78.
median = 78.
Question 6.
Find the first and the third quartiles.
Answer:
The first quartile is $2 and the third quartile is $5.
Explanation:
In the above-given question,
given that,
A box plot shows the distribution of the costs of used books.
The box of the box plot starts at $2 and ends at $5.
Alex says this means that about one-quarter of the books cost between $2 and $5.
$2 is on the first quartile.
$5 is on the third quartile.
Question 7.
Draw a box plot that shows the distribution of Sarah’s test scores.
Answer:
Question 8.
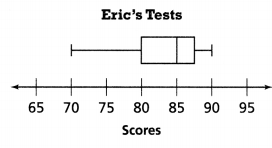
Eric is in Sarah’s class. This box plot shows his scores on the same nine tests. How do Eric’s scores compare to Sarah’s?
Answer:
Eric’s tests is 85.
Explanation:
In the above-given question,
given that,
Eric is in Sarah’s class.
This box plot shows his scores on the same nine tests.
85/9 = 9.4.
Eric’s tests is 85.
Practice & Problem Solving
Multimedia Leveled Practice in 9 and 10, use this data set, which shows how many minutes Enzo practiced violin each day for 10 days.
40, 25, 45, 55, 30, 25, 30, 50, 30, 40
Question 9.
Find the statistical measures that you need to make a box plot of Enzo’s practice times.
Answer:
Median = 30.
Explanation:
In the above-given question,
given that,
which shows how many minutes Enzo practiced violin each day for 10 days.
40, 25, 45, 55, 30, 25, 30, 50, 30, 40.
minimum is 25.
first quartile = 30.
Median = 30.
third quartile = 45.
maximum = 55.
Question 10.
Complete the box plot to represent Enzo’s practice times.
Answer:
The missing values are 30, 30, 30, 40, 55.
Explanation:
In the above-given question,
given that,
40, 25, 45, 55, 30, 25, 30, 50, 30, 40.
minimum is 25.
first quartile = 30.
Median = 30.
third quartile = 45.
maximum = 55.
In 11 and 12, use this data set, which shows the prices, in dollars, of tickets to 10 plays at the community theater.
14, 22, 8, 14, 16, 8, 20, 14, 10, 18
Question 11.
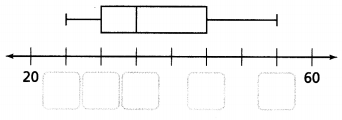
Find the minimum, maximum, median, and quartile ticket prices.
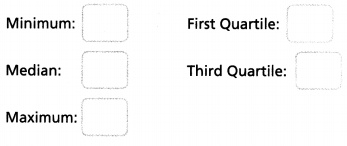
Answer:
Minimum = 14.
Median = 14.
Maximum = 18.
First quartile = 10.
Third quartile = 18.
Explanation:
In the above-given question,
given that,
the data is 14, 22, 8, 14, 16, 8, 20, 14, 10, 18.
the order is 8, 8, 10, 14, 14, 14, 16, 18, 20, 22.
minimum = 14.
maximum = 18.
median = 14.
first quartile = 10.
third quartile = 18.
Question 12.
Make a box plot to display the ticket prices.
Answer:
In 13 and 14, draw box plots using the data provided.
Question 13.
The sprint times, in seconds, of students who tried out for the track team:
44, 40, 40, 42, 49, 43, 41, 47, 54, 48, 42, 52, 48
Answer:
Minimum = 40.
Median = 43.5.
Maximum = 54.
First quartile = 42.
Third quartile = 52.
Explanation:
In the above-given question,
given that,
the sprint times in seconds, of students who tried out for the track team:
44, 40, 40, 42, 49, 43, 41, 47, 54, 48, 42, 52, 48.
the order is 40, 40, 41, 42, 42, 43, 44, 47, 48, 49, 52, 54.
minimum = 40.
maximum = 54.
median = 43.5.
first quartile = 41.
third quartile = 52.
Question 14.
Scores earned on science tests:
73, 78, 66, 61, 85, 90, 99, 76, 64, 70, 72, 72, 93, 81
Answer:
Minimum = 40.
Median = 43.5.
Maximum = 54.
First quartile = 42.
Third quartile = 52.
Explanation:
In the above-given question,
given that,
the scores earned on science tests:
73, 78, 66, 61, 85, 90, 99, 76, 64, 70, 72, 72, 93, 81.
the order is 70, 72, 72, 73, 76, 78, 81, 85, 90, 93, 99.
minimum = 70.
maximum = 99.
median = 78.
first quartile = 72.
third quartile = 93.
In 15 and 16, use the box plot to answer the question.
Question 15.
How many words per minute does the fastest keyboarder type?
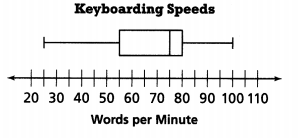
Answer:
The words per minute do the fastest keyboarder type = 75.
Explanation:
In the above-given question,
given that,
the keyboarding speeds and words per minute.
the data is 20, 30, 40, 50, 60, 70, 80, 90, 100, 110.
1 minute = 60 seconds.
the box plot is on 75.
so the words per minute do the fastest keyboarder type = 75.
Question 16.
How many words per minute do the fastest 50% of keyboarders type?
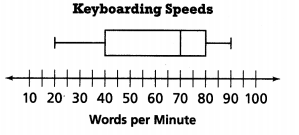
Answer:
The number of words per minute does the fastest 50% of keyboarders type = 70.
Explanation:
In the above-given question,
given that,
the keyboarding speeds and words per minute.
the data is 20, 30, 40, 50, 60, 70, 80, 90, 100, 110.
1 minute = 60 seconds.
the box plot is on 70.
so the number of words per minute does the fastest 50% of keyboarders type = 70.
Question 17.
Reasoning the price per share of Electric Company’s stock during 9 days, rounded to the nearest dollar, was as follows: $16, $17, $16, $16, $18, $18, $21, $22, $19.
Use a box plot to determine how much greater the third quartile’s price per share was than the first quartile’s price per share.
Answer:
third quartile’s price is 5 times greater than the first quartile’s price.
Explanation:
In the above-given question,
given that,
the price per share of Electric Company’s stock during 9 days, rounded to the nearest dollar, was as follows: $16, $17, $16, $16, $18, $18, $21, $22, $19.
the order is $16, $16, $16, $17, $18, $18, $19, $21, $22.
the first quartile = $16.
third quartile = $21.
$21 – $16 = $5.
so the third quartile’s price is 5 times greater than the first quartile’s price.
Question 18.
Make Sense and Persevere The temperature forecast for Topeka, Kansas, for the next 8 days is shown. Use a box plot to determine the range for the lower half of the temperatures.
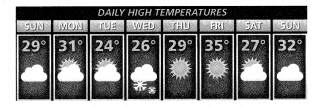
Answer:
The range for the lower half of the temperatures = 7 degrees.
Explanation:
In the above-given question,
given that,
The temperature forecast for Topeka, Kansas, for the next 8 days is shown.
29 and 32 degrees on Sunday.
31 degrees on monday.
24 degrees on Tuesday.
26 degrees on Wednesday.
29 degrees on Thursday.
35 degrees on Friday.
27 degrees on Saturday.
range = 31 – 24.
range = 7.
Question 19.
Model with Math Coach Henderson clocked the speeds in miles per hour of pitches thrown during the first inning of a middle school baseball game, as shown at the right.
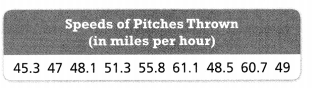
Draw a box plot to display the data and write two conclusions about the data shown in the box plot.
Answer:
Minimum = 45.3.
Maximum = 61.1.
Explanation:
In the above-given question,
given that,
speeds of pitches thrown in miles per hour.
45.3, 47, 48.1, 51.3, 55.8, 61.1, 48.5, 60.7, 49.
the order is 45.3, 47, 48.1, 48.5, 49, 51.3, 55.8, 60.7, 61.1.
minimum = 45.3.
maximum = 61.1.
Question 20.
Critique Reasoning Tanya recorded the ages of 10 local babysitters: 20, 16, 18, 13, 14, 13, 12, 16, 22, 18. She says that the box plot below shows the distribution of ages. What error did she make?
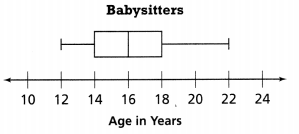
Answer:
The error is 13.
Explanation:
In the above-given question,
given that,
Tanya recorded the ages of 10 local babysitters: 20, 16, 18, 13, 14, 13, 12, 16, 22, 18.
the order is 12, 13, 13, 14, 16, 16, 18, 20, 22.
she says that the box plot shows the distribution of ages.
the age in years = 10, 12, 14, 16, 18, 20, 22, 24.
there is no 13 in the data.
so the erroe is 13.
Question 21.
Higher Order Thinking Alana made this box plot to represent classroom attendance last month. Without seeing the values, what conclusions can you make about whether attendance was mostly high or low last month? Explain.
Answer:
The attendance was mostly high.
Explanation:
In the above-given question,
given that,
Alana made this box plot to represent classroom attendance last month.
the attendance was mostly high last month.
because the line plot and box are shown in last.
so the attendance was mostly high.
Assessment Practice
Question 22.
Use the data given to complete the box plot.
The ages in years of the students in Caryn’s gymnastics class are shown in the table.
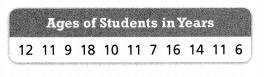
Complete the box plot to show the distribution of the students’ ages.
Answer:
minimum = 6.
maximum = 18.
median = 11.
first quartile = 9.
third quartile = 12.
Explanation:
In the above-given question,
given that,
ages of students in years are given.
the data is 12, 11, 9, 18, 10, 11, 7, 16, 14, 11, 6.
the order is 6, 7, 9, 10, 11, 11, 11, 12, 14, 16, 18.
minimum = 6.
maximum = 18.
median = 11.
first quartile = 9.
third quartile = 12.
Lesson 8.4 Display Data in Frequency Tables and Histograms
Explore It!
The students in a sixth-grade class recorded the number of letters in their first and last names combined.
I can… make and analyze frequency tables and histograms.
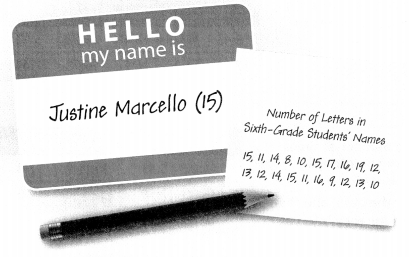
A. How can the data be organized? Describe one way to organize the data.
Answer:
The data can be organized in two ways.
Explanation:
In the above-given question,
given that,
the data can be organized in two ways.
they are:
frequency tables and the histograms.
B. Describe another way to organize the data.
Answer:
Another way to organize the data is histograms.
Explanation:
In the above-given question,
given that,
the data can be organized in two ways.
they are:
frequency tables and the histograms
C. Compare the two ways. What do you notice about the data in each way?
Answer:
Focus on math practices
Generalize What generalization can you make about the data set?
Essential Question
How can a frequency table or histogram help you organize and analyze data?
Try It!
This histogram shows a different way to represent Mr. Maxwell’s data. Fill in the boxes with appropriate times and shade the bars for the last three intervals. How have the intervals changed?
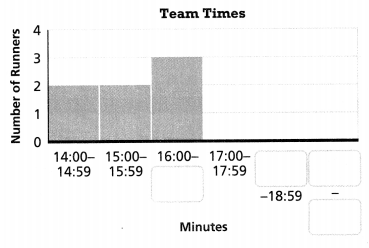
Answer:
The missing values are 18:00, 19:00, 16:59, and 19:59.
Explanation:
In the above-given question,
given that,
This histogram shows a different way to represent Mr. Maxwell’s data.
the number of runners is 5.
the number of minutes is 14:00, 15:00, 16:00…..
so the missing values are 18:00, 19:00, 16:59, and 19:59.
Convince Me! How is the analysis of the information displayed different between the two histograms?
Try It!
How many students sent between 20 and 59 texts?
Answer:
The number of students who sent between 20 and 59 texts = 39.
Explanation:
In the above-given question,
given that,
the students are from 20 to 59.
59 – 20 = 39.
so the number of students who sent between 20 and 59 texts = 39.
Try It!
Does the histogram show the mode of the number of points Kendra scored in the games? Explain.
Answer:
KEY CONCEPT
Data displays can be used to help make sense of data.
Do You Understand?
Question 1.
Essential Question How can a frequency table or histogram help you organize and analyze data?
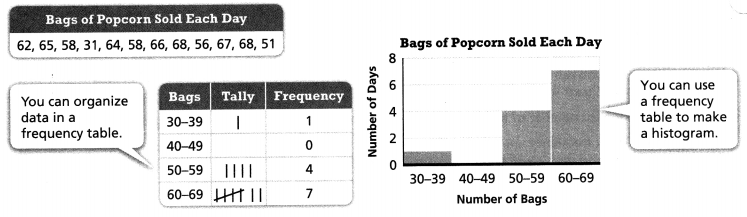
Answer:
We can use a frequency table to make a histogram.
Explanation:
In the above-given question,
given that,
bags of popcorn are sold each day.
the data is 62, 65, 58, 31, 64, 58, 66, 68, 56, 67, 68, 51.
we can organize the data in a frequency table.
we can also use a frequency table to make a histogram.
Question 2.
How is a histogram different from a bar graph?
Answer:
The histogram and bar graph are the same.
Explanation:
In the above-given question,
given that,
the histogram is converted by a frequency table.
the bar graph is also converted by a frequency table.
so both the histogram and bar graph are the same.
Question 3.
What types of numerical data sets are easier to display using a histogram instead of a dot plot? Explain.
Answer:
Explanation:
the numerical data sets are easier to display using a histogram instead of a dot plot in a frequency table.
Explanation:
In the above-given question,
given that,
bags of popcorn are sold each day.
the data is 62, 65, 58, 31, 64, 58, 66, 68, 56, 67, 68, 51.
we can organize the data in a frequency table.
so the numerical data sets are easier to display using a histogram instead of a dot plot in a frequency table.
Question 4.
Reasoning How are frequency tables and histograms alike and how are they different?
Answer:
Do You Know How?
Question 5.
A data set contains ages ranging from 6 to 27.
6, 11, 9, 13, 18, 15, 21, 15, 17, 24, 27, 12
Complete the frequency table and histogram.
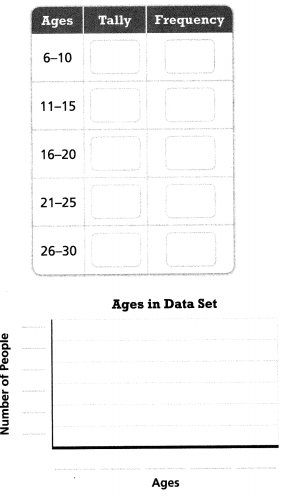
Answer:
The missing frequency are 1, 5, 2, 2, and 1.
Explanation:
In the above-given question,
given that,
A data set contains ages ranging from 6 to 27.
6, 11, 9, 13, 18, 15, 21, 15, 17, 24, 27, 12.
6 to 10 = 1.
11 to 15 = 5.
16 to 20 = 2.
21 to 25 = 2.
26 to 30 = 1.
Practice & Problem Solving
Leveled Practice In 6-11, use the data in the chart.
Question 6.
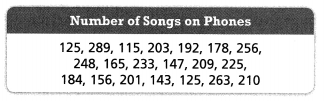
Complete the frequency table below for the number of songs stored on phones.
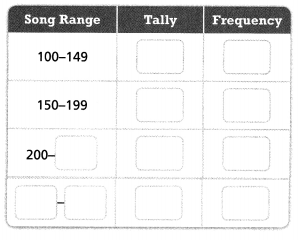
Answer:
The missing frequency is 5, 7, 2, 0.
Explanation:
In the above-given question,
given that,
the number of songs on the phones.
the data is 125, 289, 115, 203, 192, 178, 256, 248, 165, 233, 147, 209, 225, 184, 156, 201, 143, 125, 263, 210.
the song range from 100 – 149 = 5.
range from 150 – 199 = 5.
range from 200 – 249 = 7.
range from 250 – 299 = 2.
range from 300 – 349 = 0.
so the missing frequency is 5, 7, 2, 0.
Question 7.
Use your frequency table to complete the histogram.
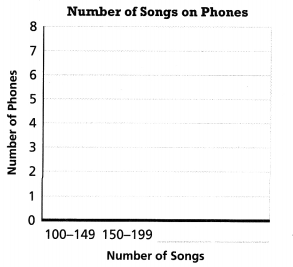
Answer:
Question 8.
How many people have between 150 and 199 songs stored on their phones?
Answer:
The number of people has between 150 and 199 is 5.
Explanation:
In the above-given question,
given that,
the number of songs on the phones.
the data is 125, 289, 115, 203, 192, 178, 256, 248, 165, 233, 147, 209, 225, 184, 156, 201, 143, 125, 263, 210.
range from 150 – 199 = 5.
so the number of people has between 150 and 199 is 5.
Question 9.
Do more than half of the phones have fewer than 149 songs stored on them?
Answer:
Yes, more than half of the phones have fewer than 149 songs stored on them.
Explanation:
In the above-given question,
given that,
the number of songs on the phones.
the data is 125, 289, 115, 203, 192, 178, 256, 248, 165, 233, 147, 209, 225, 184, 156, 201, 143, 125, 263, 210.
the song range from 100 – 149 = 5.
range from 150 – 199 = 5.
range from 200 – 249 = 7.
range from 250 – 299 = 2.
range from 300 – 349 = 0.
the number of songs stored on them = 19.
so more than half of the phones have fewer than 149 songs stored on them.
Question 10.
Is the greatest number of songs stored on phones between 200 and 249 songs?
Answer:
Yes, the greatest number of songs stored on phones is between 200 and 249 songs = 7.
Explanation:
In the above-given question,
given that,
the number of songs on the phones.
the data is 125, 289, 115, 203, 192, 178, 256, 248, 165, 233, 147, 209, 225, 184, 156, 201, 143, 125, 263, 210.
the song range from 100 – 149 = 5.
range from 150 – 199 = 5.
range from 200 – 249 = 7.
range from 250 – 299 = 2.
range from 300 – 349 = 0.
so the greatest number of songs stored on phones is between 200 and 249 songs = 7.
Question 11.
Are there more phones that have between 200 and 249 songs stored on them than have between 150 and 199 songs?
Answer:
There are more phones that have between 200 and 249 = 7.
Explanation:
In the above-given question,
given that,
the number of songs on the phones.
the data is 125, 289, 115, 203, 192, 178, 256, 248, 165, 233, 147, 209, 225, 184, 156, 201, 143, 125, 263, 210.
the song range from 100 – 149 = 5.
range from 150 – 199 = 5.
range from 200 – 249 = 7.
range from 250 – 299 = 2.
range from 300 – 349 = 0.
so there are more phones that have between 200 and 249 = 7.
In 12-14, use the data in the histogram.
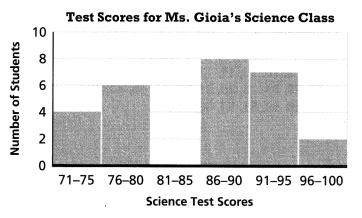
Question 12.
How many students in Ms. Gioia’s class took the science test?
Answer:
The number of students in Ms. Gioia’s class who took the science test = 6.
Explanation:
In the above-given question,
given that,
the number of students is 6.
the science test scores are 71 to 75, 76 60 80, 86 to 90, 91 to 95, and 96 to 100.
so the number of students in Ms. Gioia’s class who took the science test = 6.
Question 13.
How many more students had scores that were 80 or lower than had scores that were higher than 90?
Answer:
The number of students who had scored that were 80 or lower than 90 = 8.
Explanation:
In the above-given question,
given that,
the number of students is 6.
the science test scores are 71 to 75, 76 60 80, 86 to 90, 91 to 95, and 96 to 100.
the number of students who had scored that were 80 or lower than 90 = 8.
Question 14.
Be Precise Can you tell from the histogram how many students scored 83 on the test? Explain.
Answer:
The number of students who scored 83 on the test = 0.
Explanation:
In the above-given question,
given that,
the number of students is 6.
the science test scores are 71 to 75, 76 60 80, 86 to 90, 91 to 95, and 96 to 100.
the number of students who had scored that were 80 or lower than 90 = 8.
so the number of students who scored 83 on the test = 0.
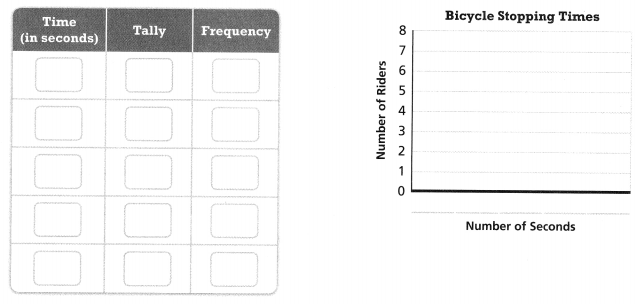
In 15-17, use the data in the chart.
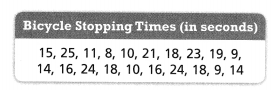
Question 15.
Reasoning Todd wants to know how many people took 20 seconds or more to stop a bike safely. Would a frequency table or a histogram be the better way to show this? Explain.
Answer:
Question 16.
Higher Order Thinking When organizing the data, what interval should Todd use? Explain.
Answer:
Question 17.
Model with Math Make a frequency table and histogram for the data.
Answer:
Assessment Practice
Question 18.
Use the data given to complete the histogram. Lissa recorded the time, in minutes, it took her to complete her homework each night for one month. 5, 7, 8, 10, 10, 11, 13, 14, 15, 15, 18, 19, 20, 20, 25, 26, 29, 31, 33, 35, 38, 40, 40, 42, 48, 50, 51, 55, 58, 71
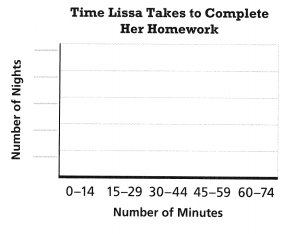
Answer:
range from 0 to 14 is 7.
range from 15 to 29 is 9.
range from 30 to 44 is 7.
range from 45 to 59 is 5.
range from 60 to 74 is 1.
Explanation:
In the above-given question,
given that,
Lissa recorded the time, in minutes, it took her to complete her homework each night for one month.
5, 7, 8, 10, 10, 11, 13, 14, 15, 15, 18, 19, 20, 20, 25, 26, 29, 31, 33, 35, 38, 40, 40, 42, 48, 50, 51, 55, 58, 71.
the number of nights is 10, 20, 30, 40, 50, and 60.
range from 0 to 14 is 7.
range from 15 to 29 is 9.
range from 30 to 44 is 7.
range from 45 to 59 is 5.
range from 60 to 74 is 1.
Topic 8 Mid-Topic Checkpoint
Question 1.
Vocabulary Which of the following describes the mean of a data set? Lesson 8-2
A. The data value that occurs most often
B. The middle data value
C. The sum of the data values divided by the total number of data values
D. The difference of the greatest and least data values
Answer:
Option c is correct.
Explanation:
In the above-given question,
given that,
for example:
11, 7, 11, 18, 9, 7, 6, 23, 7.
the total value of the numbers divided by how many numbers there are.
99/9 = 11.
so option c is correct.
Question 2.
A P.E. teacher recorded how many sit-ups the students in her class did in one minute. Select all the statements that describe the data. Lesson 8-4
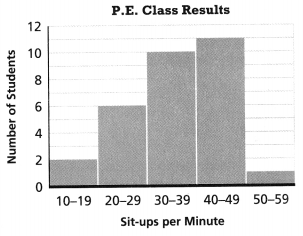
☐ Every student did at least 10 sit-ups in one minute.
☐ Two students did 50 or more sit-ups in one minute.
☐ Eight more students did 30 to 39 sit-ups than did 10 to 19 sit-ups.
☐ More than half of the students did 40 or more sit-ups in one minute.
☐ There are 30 students in the class.
Answer:
Options A and D are correct.
Explanation:
In the above-given question,
given that,
A P.E. teacher recorded how many sit-ups the students in her class did in one minute.
situps per minute are given per minute.
every student did at least 10 sit-ups in one minute.
more than half of the students did 40 or more sit-ups in one minute.
so options A and D are correct.
In 3 and 4, determine whether each question is statistical or not statistical. Explain.
Question 3.
How many pages did Liz read yesterday? Lesson 8-1
Answer:
The number of pages did Liz read yesterday is 3.
Explanation:
In the above-given question,
given that,
the question is statistical.
the number of pages did Liz read yesterday is 3.
Question 4.
How many books did each of the students in grade 6 read last year? Lesson 8-1
Answer:
The number of books did each of the students in grade 6 read last year = 6.
Explanation:
In the above-given question,
given that,
in grade 6 there are 3 students.
each student read 2 books.
3 x 2 = 6.
so the number of books did each of the students in grade 6 read last year = 6.
In 5 and 6, use the table of cousins’ ages at a family reunion.
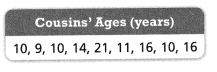
Question 5.
Make a box plot of the ages. Lesson 8-3
Answer:
minimum = 9.
maximum = 21.
Explanation:
In the above-given question,
given that,
the cousins’ ages in years.
the data is 10, 9, 10, 14, 21, 11, 16, 10, 16.
order is 9, 10, 10, 10, 11, 14, 16, 16, 21.
minimum = 9.
maximum = 21.
Question 6.
One 8-year-old cousin could not make it to the reunion. Select all the ways the measures of center of the data set change if she had attended the reunion. Lesson 8-2
☐ The median increases by 1
☐ The mode decreases by 1
☐ The mean increases by 0.5
☐ The mean decreases by 0.5
☐ The median decreases by 0.5
Answer:
The median increases by 1.
Explanation:
In the above-given question,
given that,
One 8-year-old cousin could not make it to the reunion.
the cousins’ ages in years.
the data is 10, 9, 10, 14, 21, 11, 16, 10, 16.
order is 9, 10, 10, 10, 11, 14, 16, 16, 21.
so the median increases by 1.
Topic 8 Mid-Topic Performance Task
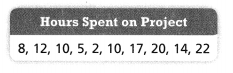
Antonia surveys a group of students entered in a school science fair. Her results are shown.
PART A
What statistical question could Antonia have asked to gather these data? Explain why the question is a statistical question.
Answer:
minimum = 2.
maximum = 22.
first quartile = 5.
third quartile = 20.
Explanation:
In the above-given question,
given that,
Antonia surveys a group of students who entered a school science fair.
hours spent on the project is given.
the data is 8, 12, 10, 5, 2, 10, 17, 20, 14, 22.
order is 2, 5, 8, 10, 12, 14, 17, 20, 22.
minimum = 2.
maximum = 22.
first quartile = 5.
third quartile = 20.
PART B
Find the mean, median, mode, and range of Antonia’s data. Draw lines to match each measure to its value.
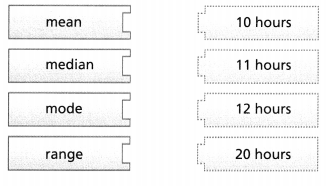
Answer:
mean = 55.
median = 6.
mode = 10.
range = 20.
Explanation:
In the above-given question,
given that,
Antonia surveys a group of students who entered a school science fair.
hours spent on the project is given.
the data is 8, 12, 10, 5, 2, 10, 17, 20, 14, 22.
order is 2, 5, 8, 10, 12, 14, 17, 20, 22.
mean = 110/2 = 55.
mode = 10.
median = 2 +10/2.
median = 6.
range = 22 – 2.
range = 20.
PART C
Choose reasonable intervals and then make a frequency table and a histogram to show Antonia’s data.
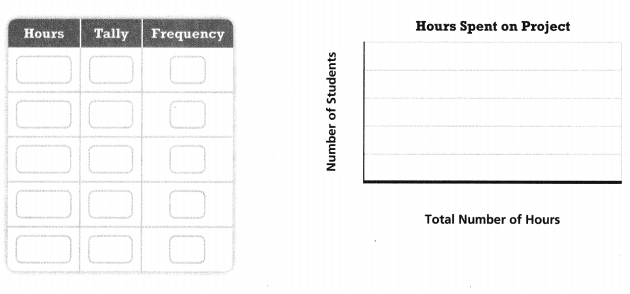
Answer:
Lesson 8.5 Summarize Data Using Measures of Variability
Solve & Discuss It!
Suppose you collected data from 11 people about the number of pieces of fruit they have eaten in the past week. The median number is 6 pieces of fruit. Make two possible dot plots that could be used to display the data–one in which the data vary a little and one in which the data vary a lot. Explain how you created your dot plots.
I can… use measures of variability to describe a data set.
Reasoning
How can you find values that have the same median?
Focus on math practices
Critique Reasoning Jackline says that only 3 people surveyed ate more than six pieces of fruit in the past week. Do you agree? Explain why or why not.
Essential Question
How can the variability of data be described using a single number?
Try It!
Ann’s vocabulary quiz scores are 75, 81, and 90. The mean score is 82. What is the mean absolute deviation?
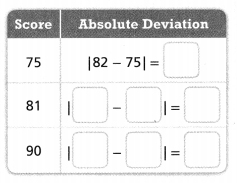
Answer:
The missing Absolute deviation is 7, 1, -8.
Explanation:
In the above-given question,
given that,
Ann’s vocabulary quiz scores are 75, 81, and 90.
The mean score is 82.
absolute deviation is 82 – 75 = 7.
absolute deviation is 82 – 81 = 1.
absolute deviation is 82 – 90 = -8.
Convince Me! Can the mean absolute deviation ever have a negative value? Explain.
Try It!
The dot plot shows the distribution of Ann’s health quiz scores. How can the IQR describe her scores?
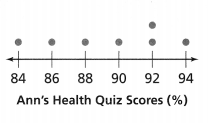
Answer:
The more number of students are 92%.
Explanation:
In the above-given question,
The dot plot shows the distribution of Ann’s health quiz scores.
Ann’s health quiz scores in percentages.
the more number of students are 92 %.
there are two students on 92%.
one student on 84, 86, 88, 90, and 94.
Try It!
Jonah’s team scored 36, 37, 38, 38, 41, 46, 47, 47, and 48 points in the last nine games. Find the IQR and range of the points Jonah’s team scored in its last nine games. Are these good measures for describing the points scored?
Answer:
Yes, these are good measures for describing the points.
Explanation:
In the above-given question,
given that,
Jonah’s team scored 36, 37, 38, 38, 41, 46, 47, 47, and 48 points in the last nine games.
the data is 36, 37, 38, 38, 41, 46, 47, 47, and 48.
range = 48 – 36.
range = 12.
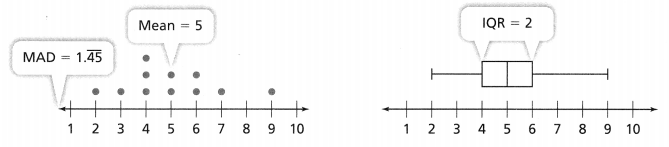
KEY CONCEPT
The mean absolute deviation and the interquartile range each use a single number to describe the variability, or spread, of a data set. The mean absolute deviation (MAD) tells you how far the data are spread out from the mean. The interquartile range (IQR) tells you how far the middle of the data is spread out from the median.
Do You Understand?
Question 1.
Essential Question How can the variability of data be described using a single number?
Answer:
Question 2.
What does the IQR show that the range does not show?
Answer:
The interquartile range (IQR) tells you how far the middle of the data is spread out from the median.
Explanation:
In the above-given question,
given that,
the interquartile range (IQR) tells you how far the middle of the data is spread out from the median.
there are 10 numbers on the number line.
interquartile range is between 4 and 6.
IQR = 6 – 4.
IQR = 2.
Question 3.
Reasoning Two data sets have the same mean, 8. However, the MAD of Data Set A is 2 and the MAD of Data Set B is 4. What does this indicate about the variability of the data sets?
Answer:
This indicate the variability of the data set is less than 8.
Explanation:
In the above-given question,
given that,
Two data sets have the same mean, 8.
the MAD of Data set A is 2.
the MAD of Data set B is 4.
4 + 2 = 6.
Do You Know How?
In 4-7, use these data. Davita works at a shoe store. She measured the feet of nine customers and found that their shoe sizes were 4, 5, 5, 6, 7, 8, 8, 10, and 10.
Question 4.
Find the mean.
Answer:
Mean = 31.5.
Explanation:
In the above-given question,
given that,
Davita works at a shoe store.
the data is 4, 5, 5, 6, 7, 8, 8, 10, and 10.
mean = 63/2.
mean = 31.5.
Question 5.
Find the sum of the absolute deviations from the mean.
Answer:
The sum of the absolute deviations from the mean = 7.
Explanation:
In the above-given question,
given that,
Davita works at a shoe store.
the data is 4, 5, 5, 6, 7, 8, 8, 10, and 10.
ADM = 63/9.
63/9 = 7.
so the sum of the absolute deviations from the mean = 7.
Question 6.
Find the mean absolute deviation. Explain how you found the MAD.
Answer:
The sum of the absolute deviations from the mean = 7.
Explanation:
In the above-given question,
given that,
Davita works at a shoe store.
the data is 4, 5, 5, 6, 7, 8, 8, 10, and 10.
ADM = 63/9.
63/9 = 7.
so the sum of the absolute deviations from the mean = 7.
Question 7.
Find the range and IQR. How is each calculated?
Answer:
The range = 6.
Explanation:
In the above-given question,
given that,
Davita works at a shoe store.
the data is 4, 5, 5, 6, 7, 8, 8, 10, and 10.
range = 10 – 4.
range = 6.
so the range = 6.
Practice & Problem Solving
Question 8.
Leveled Practice The mean of the data set is 3. Find the absolute deviation of each of the green values.
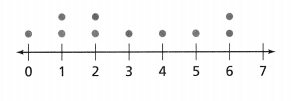
a. The absolute deviation of 1 is _______.
Answer:
The absolute deviation of 1 is 2.
Explanation:
In the above-given question,
given that,
The mean of the data set is 3.
the absolute deviation of 1 is 2.
the numbers on the number line is 7.
the numbers are from 0 to 7.
the absolute deviation of 1 is 2.
b. The absolute deviation of 2 is _______.
Answer:
The absolute deviation of 2 is 2.
Explanation:
In the above-given question,
given that,
The mean of the data set is 3.
the absolute deviation of 2 is 2.
the numbers on the number line is 7.
the numbers are from 0 to 7.
the absolute deviation of 2 is 2.
c. The absolute deviation of 5 is _______.
Answer:
The absolute deviation of 5 is 1.
Explanation:
In the above-given question,
given that,
The mean of the data set is 3.
the absolute deviation of 5 is 1.
the numbers on the number line is 7.
the numbers are from 0 to 7.
the absolute deviation of 5 is 1.
In 9 and 10, use the data table showing the number of miles that Jill biked on 9 days.
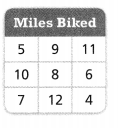
Question 9.
Find the mean.
Answer:
Mean = 8.
Explanation:
In the above-given question,
given that,
the number of miles that Jill biked on 9 days.
miles biked are given.
the data is 5, 9, 11, 10, 8, 6, 7, 12, and 4.
mean = 72/9.
mean = 8.
Question 10.
Find the MAD of this data set. What does this tell you about the number of miles that Jill biked?
Answer:
MAD = 8.
Explanation:
In the above-given question,
given that,
the number of miles that Jill biked on 9 days.
miles biked are given.
the data is 5, 9, 11, 10, 8, 6, 7, 12, and 4.
mean = 72/9.
mean = 8.
In 11 and 12, use the data shown in the dot plot.
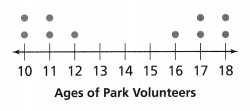
Question 11.
What are the mean and the MAD?
Answer:
Mean = 14.
Explanation:
In the above-given question,
given that,
Ages of park volunteers are given.
the data is 10, 11, 12, 13, 14, 15, 16, 17, 18.
mean = 126/9.
mean = 14.
Question 12.
Describe the variability of the data.
Answer:
Range = 8.
Explanation:
In the above-given question,
given that,
Ages of park volunteers are given.
the data is 10, 11, 12, 13, 14, 15, 16, 17, 18.
range = 18 – 10.
range = 8.
In 13 and 14, use the data shown in the box plot.
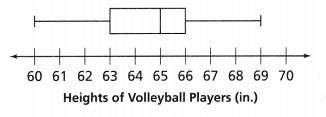
Question 13.
What are the range and the IQR?
Answer:
Range = 10.
Explanation:
In the above-given question,
given that,
Heights of volleyball players(in.).
the numbers on the line are:
60, 61, 62, 63, 64, 65, 66, 67, 68, 69, 70.
range = maximum – minimum.
range = 70 – 60.
range = 10.
Question 14.
Describe the variability of the data.
Answer:
IQR = 3.
Explanation:
In the above-given question,
given that,
Heights of volleyball players(in.).
the numbers on the line are:
60, 61, 62, 63, 64, 65, 66, 67, 68, 69, 70.
IQR = 66 – 63.
IQR = 3.
Question 15.
The data set shows prices for concert tickets in 10 different cities in Florida.
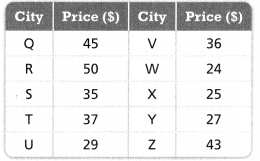
a. Find the IQR of the data set.
Answer:
IQR of the data set = 8.
Explanation:
In the above-given question,
given that,
The data set shows prices for concert tickets in 10 different cities in Florida.
the data is 45, 50, 35, 37, 29, 36, 24, 25, 27, 43.
the order is 24, 25, 27, 29, 35, 36, 37, 43, 45, and 50.
IQR = 37 – 29.
IQR = 8.
b. How do prices vary within the middle 50%?
Answer:
Question 16.
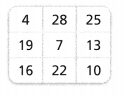
Reasoning The MAD of the data set in the table is about 6.7. Does the value 4 deviate more or less than most of the values in the table? Explain.
Answer:
Mean = 16.
Explanation:
In the above-given question,
given that,
The MAD of the data set in the table is about 6.7.
the data is 4, 28, 25, 19, 7, 13, 16, 22, 10.
order is 4, 7, 10, 13, 16, 19, 22, 25, 28.
mean = 144/9.
mean = 16.
In 17-19, use the data set shown in the table.
Question 17.
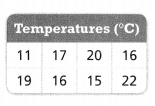
Vocabulary What is the term used to describe the range of the middle half of the data set? Find that value for this data.
Answer:
Range = 11.
Explanation:
In the above-given question,
given that,
the term used to describe the range of the middle half of the data set.
temperatures are shown.
11, 17, 20, 16, 19, 16, 15, 22.
range = 22 – 11.
range = 11.
Question 18.
Critique Reasoning Dina said that the greatest absolute deviation will be found from the highest temperature because it has to be the farthest from the mean. Is she correct? Explain.
Answer:
MAD = 17.
Explanation:
In the above-given question,
given that,
11, 17, 20, 16, 19, 16, 15, 22.
MAD = 11 + 17 + 20 +16 + 19 + 16 + 15 + 22.
MAD = 136/8.
MAD = 17.
Question 19.
Higher Order Thinking What is the MAD for the data and what does it tell you about the temperatures?
Answer:
Assessment Practice
Question 20.
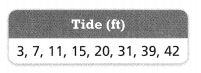
Harlo recorded the tide, in feet, every hour during an 8-hour period as shown in the table.
PART A
What is the MAD for the data set?
Answer:
MAD = 21.
Explanation:
In the above-given question,
given that,
Harlo recorded the tide, in feet, every hour during an 8-hour period.
the tides in feet are 3, 7, 11, 15, 20, 31, 39, 42.
MAD = 168/8.
MAD = 21.
PART B
Select all the statements that best describe the IQR, MAD, and variability of the data set.
☐ The middle 50% of the data is spread out more than the average variation.
☐ The IQR is greater than the MAD.
☐ The middle 25% of the data is spread out more than the average variation.
☐ The IQR is less than the MAD.
☐ The MAD shows that the tides generally varied greatly from the mean.
Answer:
Options B and E are correct.
Explanation:
In the above-given question,
Harlo recorded the tide, in feet, every hour during an 8-hour period.
the tides in feet are 3, 7, 11, 15, 20, 31, 39, 42.
MAD = 168/8.
MAD = 21.
so options B and E are correct.
Lesson 8.6 Choose Appropriate Statistical Measures
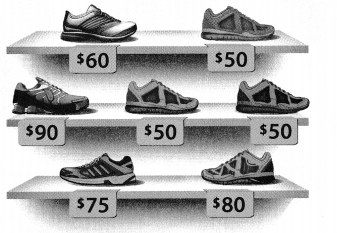
Solve & Discuss It!
The prices in dollars of athletic shoes in one store are shown below. Does the mean, median, or mode best describe the typical price for shoes at this store?
I can… select and use appropriate statistical measures.
Look for Relationships
How can you use the spread and clustering of data to help decide which statistical measures to use?
Focus on math practices
Construct Arguments which measure would the store most likely use in its advertising? Explain why this measure should be used.
Essential Question
Why is one statistical measure more useful than another to describe a given situation?
Try It!
If Gary scored a 70 on his next weekly quiz, how would that affect his mean score?
Answer:
Convince Me! Gary says that he usually scores 98 on his weekly quiz. What measure of center did Gary use? Explain.
Try It!
Suppose the French teacher says that she will drop each student’s lowest quiz score. Would the MAD now be a good measure of variability for John’s quiz scores? Calculate the MAD without John’s lowest score and use it to justify your answer.
John’s lowest score is ______.
Without the lowest score, John’s mean score is _______.
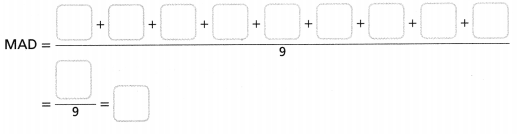
Answer:
MAD = 5.
Explanation:
In the above-given question,
given that,
I am assuming the data is 1, 2, 3, 4, 5, 6, 7, 8, 9.
MAD = 1 + 2 + 3 + 4 + 5 + 6 + 7 + 8 + 9/9.
MAD = 45/9.
MAD = 5.
KEY CONCEPT
The statistical measure that is most appropriate to describe the center and variability of a data set should be chosen based on an analysis of the spread, clustering, and outliers in the data set.
The mean is a good choice to describe the center of a data together.
When the mean is used, the mean absolute deviation (MAD) is a good choice to describe the variability.
The median is a good choice to describe the center of a data set set when the data are clustered when the data contain an outlier.
When the median is used, the interquartile range (IQR) is a good choice to describe the variability.
The mode is sometimes a good choice to describe the center of a data set if the data is not numeric or does not fall in intervals.
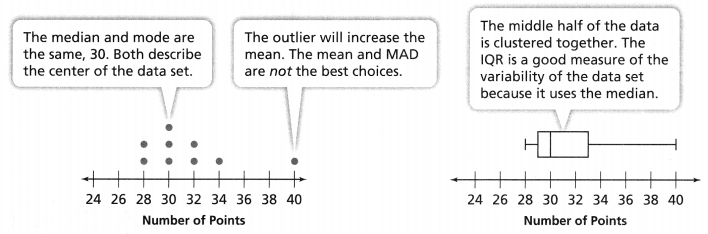
Do You Understand?
Question 1.
Essential Question Why is one statistical measure more useful than another to describe a given situation?
Answer:
The statistical measure that is most appropriate to describe the center and variability of a data set should be chosen based on an analysis of the spread, clustering, and outliers in the data set.
Explanation:
In the above-given question,
given that,
The mean is a good choice to describe the center of a data together.
When the mean is used, the mean absolute deviation (MAD) is a good choice to describe the variability.
The median is a good choice to describe the center of a data set set when the data are clustered when the data contain an outlier.
When the median is used, the interquartile range (IQR) is a good choice to describe the variability.
Question 2.
Reasoning You cannot find a good measure of center for a data set. What is probably true of the data set?
Answer:
Yes, we cannot find a good measure of center for a data set.
Explanation:
In the above-given question,
given that,
The mean is a good choice to describe the center of a data together.
When the mean is used, the mean absolute deviation (MAD) is a good choice to describe the variability.
The median is a good choice to describe the center of a data set set when the data are clustered when the data contain an outlier.
When the median is used, the interquartile range (IQR) is a good choice to describe the variability.
so we cannot find a good measure of center for a data set.
Do You Know How?
In 3-5, use the basketball team’s scores for one season: 44, 43, 42, 40, 42, 45, 39, 38, 18.
Question 3.
Find the mean, median, and mode of the scores.
Answer:
Mean = 39.
median = 42.
mode = 42.
Explanation:
In the above-given question,
given that,
the data is 44, 43, 42, 40, 42, 45, 39, 38, 18.
mean = 44 + 43 + 42 + 40 + 42 + 45 + 39 + 38 + 18.
mean = 351/9.
mean = 39.
mode = 42.
median = 42.
Question 4.
Is the median or mean the best measure of center for these data? Explain.
Answer:
Median is the best measure of center for the data.
Explanation:
In the above-given question,
given that,
the data is 44, 43, 42, 40, 42, 45, 39, 38, 18.
mean = 44 + 43 + 42 + 40 + 42 + 45 + 39 + 38 + 18.
mean = 351/9.
mean = 39.
mode = 42.
median = 42.
so median is the best measure of center for the data.
Question 5.
Find the measure of variability that best describes the data set.
Answer:
Practice & Problem Solving
In 6-8, use the data to answer the questions. Each of five different stores sell a quart of milk for one of the following prices: $1.50, $1.55, $1.80, $1.70, $1.50.
Question 6.
What are the mean, median, and mode of the data?
Answer:
Mean = $1.61.
median = $1.80.
mode = $1.50.
Explanation:
In the above-given question,
given that,
the data is $1.50, $1.55, $1.80, $1.70, $1.50.
mean = 8.05/5.
mean = $1.61.
median = $1.80.
mode = $1.50.
Question 7.
Which measure of center best describes these data? Which measure of variability?
Answer:
Mean describes the center of the data.
Explanation:
In the above-given question,
given that,
the data is $1.50, $1.55, $1.80, $1.70, $1.50.
mean = 8.05/5.
mean = $1.61.
median = $1.80.
mode = $1.50.
Question 8.
Find the best measure of variability for these data. Describe the variability.
Answer:
The best measure of variability for these data = median.
Explanation:
In the above-given question,
given that,
the data is $1.50, $1.55, $1.80, $1.70, $1.50.
mean = 8.05/5.
mean = $1.61.
median = $1.80.
mode = $1.50.
In 9-11, use the dot plot at the right.
The dot plot shows the hourly wages of cashiers at a supermarket.
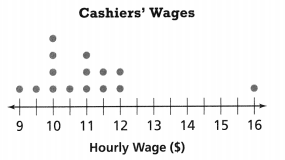
Question 9.
a. Is the median, mean, or mode the best measure of center for these data? Explain.
Answer:
mean = 10.4.
median = 11.
mode = 10.
Explanation:
In the above-given question,
given that,
the data is 9, 9.5, 10, 10, 10, 10, 10.5, 11, 11, 11, 11.5, 11.5, 12, 12, 16.
mean = 156/15.
mean = 10.4.
median = 11.
mode = 10.
b. Find that measure of center.
Answer:
The measure of center = mean.
Explanation:
In the above-given question,
given that,
the data is 9, 9.5, 10, 10, 10, 10, 10.5, 11, 11, 11, 11.5, 11.5, 12, 12, 16.
mean = 156/15.
mean = 10.4.
median = 11.
mode = 10.
Question 10.
Identify a good measure of variability for these data. Find the value.
Answer:
The good measure of variability of data is median.
Explanation:
In the above-given question,
given that,
the data is 9, 9.5, 10, 10, 10, 10, 10.5, 11, 11, 11, 11.5, 11.5, 12, 12, 16.
mean = 156/15.
mean = 10.4.
median = 11.
mode = 10.
Question 11.
Write a sentence describing the variability of the wages.
Answer:
Question 12.
Critique Reasoning Hayden looks at the dot plot. He believes that the data set contains outliers and argues that the best measure of variability is the IQR because the median is a good measure to describe a data set that contains outliers. Is Hayden correct? Explain.
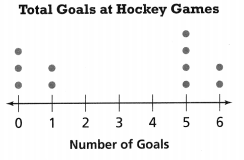
Answer:
Median = 5.
Explanation:
In the above-given question,
given that,
Hayden looks at the dot plot.
the total goals at Hockey games are given.
the number of goals are:
0, 1, 2, 3, 4, 5, 6.
the number of goals on 0 are 3.
number of goals on 1 are 2.
the number of goals on 5 are 4.
the number of goals on 6 are 2.
1, 1, 2, 5, 5, 5, 5, 5, 4, 6, 6.
median = 5.
In 13-16, use the table at the right.
The table shows measures of center based on 5 data points for attendance at a national skateboarding competition.
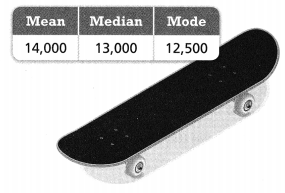
Question 13.
Vocabulary What is the term and the value of the middle number of the data set?
Answer:
The term and the value of the middle number of the data set = 14000.
Explanation:
In the above-given question,
given that,
mean = 14000.
median = 13000.
mode = 12500.
the term and the value of the middle number of the data set = 14000.
Question 14.
Make Sense and Persevere Which value in the data set occurs at least twice? Can it occur 3 times? Explain.
Answer:
Question 15.
Reasoning Why must the other two numbers in the data set be greater than or equal to 13,000?
Answer:
Question 16.
Model with Math What must be the sum of the two remaining numbers, x and y? Write an equation to show how to find this sum.
Answer:
In 17 and 18, use the table.
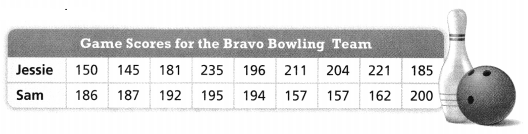
Question 17.
Be Precise The coach needs to choose the top bowler for the next meet. If the coach bases her decision on the player with the best average, whom should she choose? Justify your answer using measures of center.
Answer:
The coach bases her decision on the player with the best average = 192.
Explanation:
In the above-given question,
given that,
Game scores for the Bravo bowling team.
Jessie 150, 145, 181, 235, 196, 211, 204, 221, 185.
Sam 186, 187, 192, 195, 194, 157, 162, 200.
the coach bases her decision on the player with the best average.
mean = 150 + 145 + 181 + 235 + 196 + 211 + 204 + 221 + 185.
mean = 1728/9.
mean = 192.
Question 18.
Higher Order Thinking If the coach bases her decision on the player who is most consistent, whom should she choose? Justify your answer using measures of variability.
Answer:
Assessment Practice
Question 19.
The table at the right shows the winning bowling scores during the last five bowling events. Select the statements that best describe the data.
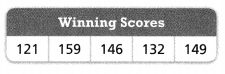
☐ There are outliers in the data set.
☐ The mean best describes the center of the data.
☐ The MAD is 11.92 points and the IQR is 27.5 points.
☐ The MAD best describes the variability.
☐ The IQR best describes the spread.
Answer:
Option B is correct.
Explanation:
In the above-given question,
given that,
the data is 121, 159, 146, 132, 149.
mean = 707/5.
mean = 141.4.
median = 146.
range = 146.
so option B is correct.
Lesson 8.7 Summarize Data Distributions
Explain It!
George tosses two six-sided number cubes 20 times. He records his results in a dot plot.
I can… summarize numerical data sets.
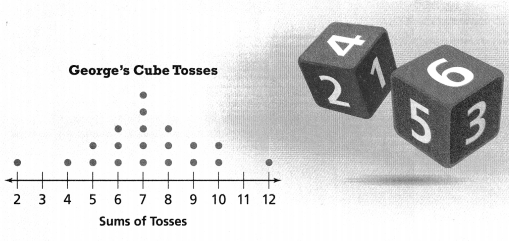
A. Describe the shape of the data distribution.
Answer:
A distribution can show gaps, clusters, or outliers.
Explanation:
In the above-given question,
given that,
A distribution can show gaps, clusters, or outliers.
It may spread out more to one side.
When the data are not symmetric, use the median and interquartile range (IQR) to describe the data.
B. Critique Reasoning George says that he expects to roll a sum of 11 on his next roll. Do you agree? Justify your reasoning.
Answer:
No, I wont agree.
Explanation:
In the above-given question,
given that,
A distribution can show gaps, clusters, or outliers.
It may spread out more to one side.
When the data are not symmetric, use the median and interquartile range (IQR) to describe the data.
the next roll is 5 + 6 + 3.
so I wont agree.
Focus on math practices
Construct Arguments Suppose George tossed the number cubes 20 more times and added the data to his dot plot. Would you expect the shape of the distribution to be different? Construct an argument that supports your reasoning.
Essential Question
How can you summarize a data distribution?
Try It!
Does the shape of the distribution match what you found when you used measures of center and variability? Explain.
Answer:
Convince Me! What are some factors that might explain why some plants grew more or less than others in the science lab?
Try It!
Why does it make sense to look at the overall shape before deciding which measures to use?
Answer:
KEY CONCEPT
To describe a set of data, look at the shape and observe how the data are clustered or spread out.
A distribution can be symmetric and clustered in the center. When the data are symmetric, use the mean and mean absolute deviation (MAD) to describe the data.
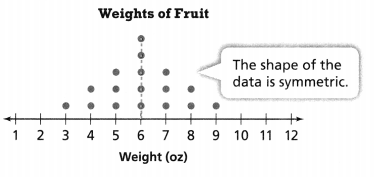
A distribution can show gaps, clusters, or outliers. It may spread out more to one side. When the data are not symmetric, use the median and interquartile range (IQR) to describe the data.
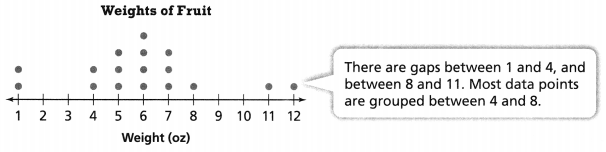
Do You Understand?
Question 1.
Essential Question How can you summarize a data distribution?
Answer:
A distribution can show gaps, clusters, or outliers.
Explanation:
In the above-given question,
given that,
A distribution can show gaps, clusters, or outliers.
It may spread out more to one side.
When the data are not symmetric, use the median and interquartile range (IQR) to describe the data.
Question 2.
Reasoning This data set has an outlier.
0, 40, 50, 60, 60, 70, 80, 80
How would the median and the mean be affected if the outlier was removed?
Answer:
Mean = 63.3.
median = 70.
Explanation:
In the above-given question,
given that,
the data is 0, 40, 50, 60, 70, 80, 80.
mean = 40 + 50 + 60 + 70 + 80 + 80/6.
mean = 380/6.
mean = 63.3.
median = 60 + 80/2.
median = 70.
Do You Know How?
Question 3.
Five different students measured the length of a shadow in inches as follows: 38, 38, 37, 38, 381. Make a generalization about the data distribution of the shadow measurements.
Answer:
Mean =106.4.
median = 37.
Explanation:
In the above-given question,
given that,
Five different students measured the length of a shadow in inches as follows: 38, 38, 37, 38, 381.
mean = 532/5.
mean = 106.4.
median = 37.
Question 4.
What are the mean, the median, and the interquartile range of the data set in Exercise 3?
Answer:
Mean =106.4.
median = 37.
Explanation:
In the above-given question,
given that,
Five different students measured the length of a shadow in inches as follows: 38, 38, 37, 38, 381.
mean = 532/5.
mean = 106.4.
median = 37.
Practice & Problem Solving
In 5-8, use the data table.
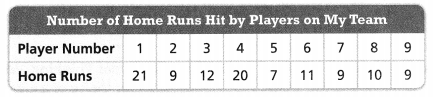
Question 5.
What are the mean and the median?
Answer:
Mean =106.4.
median = 7.
Explanation:
In the above-given question,
given that,
number of home runs hit by players on My team.
player numbers: 1, 2, 3, 4, 5, 6, 7, 8, 9.
Home runs: 21, 9, 12, 20, 7, 11, 9, 10, 9,
mean = 108/9.
mean = 12.
median = 7.
Question 6.
Draw a box plot of the data.
Answer:
Question 7.
Describe the overall shape of the data.
Answer:
Question 8.
Make a generalization about the data distribution.
Answer:
Question 9.
Be Precise A doctor asked 15 people how many hours they spend exercising each week. The dot plot displays the data.
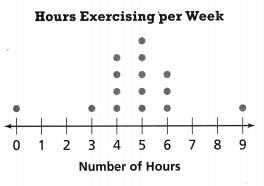
What do any clusters and gaps in the dot plot tell you about the exercise habits of these people?
Answer:
There are gaps between 0 – 3 and 6 – 9.
Explanation:
In the above-given question,
given that,
A doctor asked 15 people how many hours they spend exercising each week.
the number of hours are 0, 1, 2, 3, 4, 5, 6, 7, 8, 9.
there are gaps in between 0 and 3.
there are also gaps in between 6 and 9.
Question 10.
Look for Relationships Describe the pattern in the dot plot. Then write about a situation that this data could represent. Explain why your situation has this pattern.
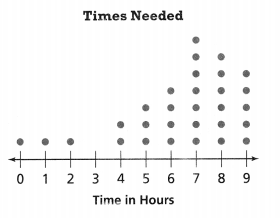
Answer:
There is one gap between 2 and 4.
Explanation:
In the above-given question,
given that,
times nedded in hours are 0, 1, 2, 3, 4, 5, 6, 7, 8, 9.
there is only one gaps between 2 and 4.
In 11 and 12, use the data in the table.
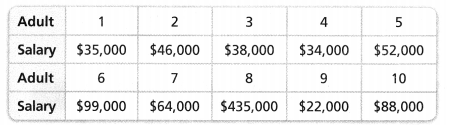
Question 11.
Model with Math Make a box plot for the data. What are the median, first quartile, third quartile, and interquartile range?
Answer:
Median = $101.5.
Fiest quartile = $38,000.
third quartile = $435,000.
Explanation:
In the above-given question,
given that,
salary of the adults are:
adult 1: $35,000.
adult 2: $46,000.
adult 3: $38,000.
adult 4: $34,000.
adult 5: $52,000.
adult 6: $99,000.
adult 7: $64,000.
adult 8: $435,000.
adult 9: $22,000.
adult 10: $88,000.
median = 52 + 99.
median = 101.5.
Question 12.
Higher Order Thinking Which data value most affects your choice of a measure of center to describe the data? Explain.
Answer:
In 13-15, use the data in the dot plot.
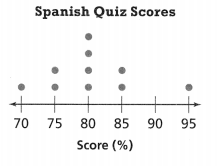
Question 13.
Describe the shape of the data.
Answer:
Question 14.
Describe the typical quiz scores of the students. Explain your choice of measure.
Answer:
Question 15.
Describe the variability of the quiz scores.
Answer:
Assessment Practice
Question 16.
Which statement about this data distribution is NOT true?
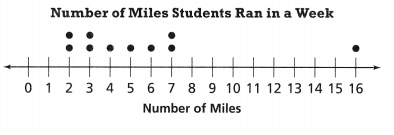
A. The interquartile range is 4.
B. The median is the preferable measure of center.
C. The data cluster from 2 to 7.
D. The distribution is symmetrical.
Answer:
Option B is not correct.
Explanation:
In the above-given question,
given that,
number of miles students ran in a week:
0, 1, 2, 3, 4, 5, 6, 7, 8, 9, 10, 11, 12, 13, 14, 15, 16.
the interquartile range is 4.
the data cluster from 2 to 7.
the distribution is symmetrical.
3-ACT MATH
3-Act Mathematical Modeling: Vocal Range

ACT 1
Question 1.
After watching the video, what is the first question that comes to mind?
Answer:
Question 2.
Write the Main Question you will answer.
Answer:
Question 3.
Make a prediction to answer this Main Question.
The person who should win the competition is _________.
Answer:
Question 4.
Construct Arguments Explain how you arrived at your prediction.

Answer:
ACT 2
Question 5.
What information in this situation would be helpful to know? How would you use that information?

Answer:
Question 6.
Use Appropriate Tools What tools can you use to solve the problem? Explain how you would use them strategically.
Answer:
Question 7.
Model with Math Represent the situation using mathematics. Use your representation to answer the Main Question.
Answer:
Question 8.
What is your answer to the Main Question? Does it differ from your initial prediction? Explain.
Answer:
АСТ 3
Question 9.
Write the answer you saw in the video.

Answer:
Question 10.
Reasoning Does your answer match the answer in the video? If not, what are some reasons that would explain the difference?
Answer:
Question 11.
Make Sense and Persevere Would you change your model now that you know the answer? Explain.

Answer:
Reflect
Question 12.
Model with Math Explain how you used a mathematical model to represent the situation. How did the model help you answer the Main Question?
Answer:
Question 13.
Use Appropriate Tools What tools or technology did you use to answer the Main Question? What other tools did your classmates use?
Answer:
SEQUEL
Question 14.
Be Precise Design your own singing competition. Explain how you would score each performance and how you would use those scores to choose a winner. Use a different method than you did to answer the Main Question.

Answer:
Topic 8 Review
Essential Question
How can data be described by a single number? How can tables and graphs be used to represent data and answer questions?
Vocabulary Review
Write always, sometimes, or never for each statement.
Question 1.
Intervals in a frequency table go beyond the values in a data set. ________
Answer:
Sometimes,Intervals in a frequency table go beyond the values in a data set.
Explanation:
In the above-given question,
given that,
sometimes in a frequency table go beyond the values in a data set.
Question 2.
You can calculate the IQR from a box plot. __________
Answer:
Yes, we can always calculate the IQR from a box plot.
Explanation:
In the above-given question,
given that,
so we can calculate the IQR from a box plot.
Question 3.
You can calculate the mean from a histogram. _________
Answer:
Yes, we can always calculate the mean from a histogram.
Explanation:
In the above-given question,
given that,
yes, we can always calculate the mean from a histogram.
Question 4.
The MAD is a negative value. _______
Answer:
Sometimes MAD is a negative value.
Explanation:
In the above-given question,
given that,
yes, sometimes MAD is a negative value.
Question 5.
The range is a measure of variability _________
Answer:
Sometimes the range is a measure of variability.
Explanation:
In the above-given question,
given that,
yes, sometimes the range is a measure of variability.
Question 6.
The mean, median, and mode are the same value. ________
Answer:
Never the mean, median, and mode are the same value.
Explanation:
In the above-given question,
given that,
never the mean, median, and mode are the same value.
Use Vocabulary in Writing
Describe measures of variability and when you would use them to summarize a data set. Use vocabulary words in your explanation.
Answer:
Concepts and Skills Review
Lesson 8.1 Recognize Statistical Questions
Quick Review
A statistical question anticipates that there will be a variety of answers.
Example
Ramon surveyed his classmates to determine the answer to the statistical question “How many hours do my classmates spend online each week?” The question yielded a variety of numerical answers. Ramon made this dot plot to display the data.
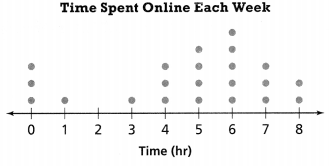
Practice
In 1-4, tell whether each question is statistical.
Question 1.
How many stations are there in a subway system?
Answer:
There are 3 stations are there in a subway system.
Explanation:
In the above-given question,
given that,
there are 3 stations are there in a subway system.
for example:
the statistical question is a direct question.
the non statistical question is an indirect question.
Question 2.
How would passengers of a subway system rate the quality of service on a scale of 1 to 10?
Answer:
The passengers of a subway system rate the quality of service on a scale of 8.
Explanation:
In the above-given question,
given that,
for example:
the passengers of a subway system rate the quality of service on a scale of 8.
Question 3.
How many passengers travel on each of the Green, Blue, Red, and Orange Lines of the subway system each day?
Answer:
The number of passengers travels on each of the Green, Blue, Red, and Orange lines of the subway system each day = 12.
Explanation:
In the above-given question,
given that,
for example:
in green the number of passengers travel = 3.
blue = 3.
red = 3.
orange = 3.
3 + 3 + 3 + 3 = 12.
Question 4.
How much does it cost for a ticket to ride the subway from Station A to Station B?
Answer:
The cost of the ticket from Station A to Station B = $40.
Explanation:
In the above-given question,
given that,
the cost of the ticket from Station A to Station B = $40.
Lesson 8.2 Summarize Data Using Mean, Median, Mode, and Range
Quick Review
The mean is the sum of all the values in a data set divided by the total number of values in the set. The median is the middle data value in a set arranged in numerical order. The mode is the value that occurs most often in a set. The range is the difference between the highest and lowest values in a set.
Example
Find the mean, median, mode, and range of the following set of data.
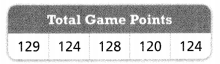
Mean: 125
Mode: 124
Median: 124
Range: 9
Practice
In 1-6, find the mean, median, mode, and range of each data set.
Question 1.
2, 5, 5
Answer:
mean = 4.
median = 5.
mode = 2.
Explanation:
In the above-given question,
given that,
the data is 2, 5, 5.
mean = 12/3.
mean = 4.
median = 5.
mode = 2.
Question 2.
11, 13, 13, 11, 13
Answer:
mean = 12.2.
median = 13.
mode = 13.
Explanation:
In the above-given question,
given that,
the data is 11, 13, 13, 11, 13.
mean = 61/5.
mean = 12.2.
median = 13.
mode = 13.
Question 3.
27, 26, 25, 20
Answer:
mean = 24.5.
median = 25.5.
mode = 0.
Explanation:
In the above-given question,
given that,
the data is 27, 26, 25, 20.
mean = 98/4.
mean = 24.5.
median = 25.5.
mode = 0.
Question 4.
100, 200, 500, 300, 500
Answer:
mean = 320.
median = 500.
mode = 500.
Explanation:
In the above-given question,
given that,
the data is 100, 200, 500, 300, 500.
mean = 1600/5.
mean = 320.
median = 500.
mode = 500.
Question 5.
1.4, 1.3, 1.1, 1.4, 1.9, 1.8, 1.7, 1.4
Answer:
mean = 1.5.
median = .65.
mode = 1.4.
Explanation:
In the above-given question,
given that,
the data is 1.4, 1.3, 1.1, 1.4, 1.9, 1.8, 1.7, 1.4.
mean = 12/8.
mean = 1.5.
median = 1.65.
mode = 1.4.
Question 6.
450, 0, 500, 750, 0
Answer:
mean = 566.
median = 500.
mode = 0.
Explanation:
In the above-given question,
given that,
the data is 450, 500, 750.
mean = 1700/3.
mean = 566.
median = 500.
mode = 0.
Lesson 8.3 Display Data in Box Plots
Quick Review
Quartiles divide a data set into four equal groups. A box plot uses the minimum, first quartile, median, third quartile, and maximum values in a data set to show how the data are distributed.
Example
Make a box plot of the distances, in feet, that seven paper airplanes flew: 60, 75, 45, 55, 70, 40, 65.
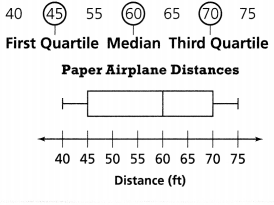
Practice
In 1 and 2, use the data to create a box plot.
Question 1.
27, 31, 30, 33, 29, 25, 28
Answer:
mean = 29.
median = 33.
mode = 0.
Explanation:
In the above-given question,
given that,
the data is 27, 31, 30, 33, 29, 25, 28.
mean = 203/7.
mean = 29.
median = 33.
mode = 0.
Question 2.
3, 1, 3, 7, 5, 2, 3, 6, 3
Answer:
mean = 3.6.
median = 5.
mode = 3.
Explanation:
In the above-given question,
given that,
the data is 3, 1, 3, 7, 5, 2, 3, 6, 3.
mean = 33/9.
mean = 3.6.
median = 5.
mode = 3.
Lesson 8.4 Display Data in Frequency Tables and Histograms
Quick Review
A frequency table shows the number of times a data value or a range of data values occurs in a data set. A histogram is a graph that uses bars to show the frequency of equal ranges or groups of data.
Example
Organize the ages of the campers listed below in a frequency table.
12, 14, 12, 14, 10, 11, 15, 13, 13, 11, 12, 12, 7, 14, 12
Divide the data into equal intervals and mark the frequency of the data using tally marks. Then write the frequency.
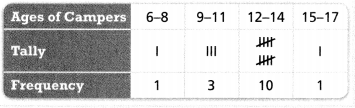
Practice
Question 1.
Represent the data in the frequency table on the left in a histogram.
Answer:
The data in the frequency table is 1.
Explanation:
In the above-given question,
given that,
the ages of the campers are:
12, 14, 12, 14, 10, 11, 15, 13, 13, 11, 12, 12, 7, 14, 12.
the frequency of 6-8 is 1.
the frequency of 9-11 is 3.
the frequency of 12-14 is 10.
the frequency of 15-17 is 1.
Lesson 8.5 Summarize Data Using Measures of Variability
Quick Review
The mean absolute deviation (MAD) describes how spread out data values are from the mean. The interquartile range (IQR) describes the difference between the third quartile and the first quartile.
Example
Find the MAD of the data set.
6, 7, 8, 8, 8, 11
Mean = 8
The absolute deviations from the mean are 2, 1, 0, 0, 0, and 3, and their sum is 6.
SO, MAD = \(\frac{6}{6}\) = 1.
Practice
In 1-3, find the mean and the MAD for each data set.
Question 1.
5, 12, 0,7
Answer:
Mean = 8.
MAD = 8.
Explanation:
In the above-given question,
given that,
the data is 5, 12, 0, 7.
mean = 24/3.
mean = 8.
MAD = 8.
Question 2.
8, 14, 22, 16
Answer:
Mean = 15.
MAD = 15.
Explanation:
In the above-given question,
given that,
the data is 8, 14, 22, 16.
mean = 60/4.
mean = 15.
MAD = 15.
Question 3.
1.25, 2.5, 3
Answer:
Mean = 2.25.
MAD = 2.25.
Explanation:
In the above-given question,
given that,
the data is 1.25, 2.5, 3.
mean = 6.75/3.
mean = 2.25.
MAD = 2.25.
In 4 and 5, find the median, first quartile, third quartile, and IQR for each data set.
Question 4.
10, 20, 35, 45, 45, 50
Answer:
Median = 35.
first quartile = 20.
third quartile = 45.
Explanation:
In the above-given question,
given that,
the data is 10, 20, 35, 45, 50.
median = 35.
first quartile = 20.
third quartile = 45.
Question 5.
24, 12, 30, 17, 32, 13, 19
Answer:
Median = 17.
first quartile = 12.
third quartile = 13.
Explanation:
In the above-given question,
given that,
the data is 24, 12, 30, 17, 32, 13, 19.
median = 17.
first quartile = 12.
third quartile = 13.
Lessons 8.6 And 8.7 Choose Appropriate Statistical Measures and Summarize Data Distributions
Quick Review
You can summarize data by finding the measure of center and the measure of variability. Use the IQR when the median is an appropriate measure of center, and the MAD when the mean is an appropriate measure of center.
Example
Use statistical measures to summarize the data set shown.
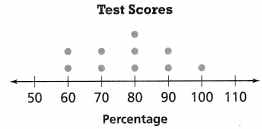
The mean and MAD are good measures to describe this data set.
The mean test score is 78 points. The MAD is 10.4, so most test scores are within 10.4 points of the mean.
Practice
In 1-3, use the data below.
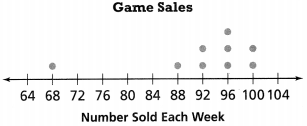
Question 1.
Describe the overall shape of the data. Include any outliers.
Answer:
The number of outliers are 4.
Explanation:
In the above-given question,
given that,
game sales and number sold each week.
64, 68, 72, 76, 80, 84, 88, 92, 96, 100, 104.
there are outliers on 88, 92, 96, 100, 104, 68.
there is gaps from 68 to 88.
so the number of outliers are 4.
Question 2.
Which measure of center and measure of variability best describe the data set? Explain.
Answer:
Question 3.
Summarize the data set.
Answer:
Topic 8 Fluency Practice
Riddle Rearranging
Find each sum or difference. Then arrange the answers in order from least to greatest. The letters will spell out the answer to the riddle below.
I can… add and subtract decimals.
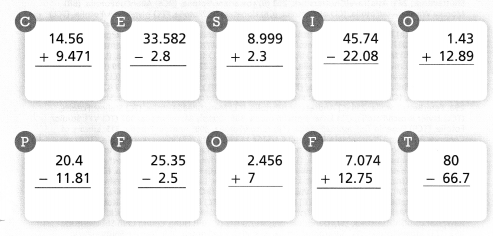
What place’s name is only two words long but has hundreds of letters in it?

Answer:
O, P, S, T, O, F, F, I, C, E.
Explanation:
In the above-given question,
given that,
14.56 + 9.471 = 24.031.
33.582 – 2.8 = 30.782.
8.999 + 2.3 = 11.299.
45.74 – 22.08 = 23.66.
1.43 + 12.89 = 14.32.
20.4 – 11.81 = 8.59.
25.35 – 2.5 = 22.85.
2.456 – 7 = -4.544.
7.074 + 12.75 = 19.824.
80 – 66.7 = 13.3.
so from least to greatest = O, P, S, T, O, F, F, I, C, E.