Practice with the help of enVision Math Common Core Grade 8 Answer Key Topic 3 Use Functions to Model Relationships regularly and improve your accuracy in solving questions.
enVision Math Common Core 8th Grade Answers Key Topic 3 Use Functions To Model Relationships
Topic 3 GET READY!
Review What You Know!
Vocabulary
Choose the best term from the box to complete each definition.
Question 1.
The ____ is the ratio of the vertical change to the horizontal change of a line.
Answer:
We know that,
The “Slope” is the ratio of the vertical change to the horizontal change of a line
Hence, from the above,
We can conclude that the best term from the box to complete the given definition is “Slope”
Question 2.
A relationship that can be modeled by the equation y = mx is a ___
Answer:
We know that,
A relationship that can be modeled by the equation y = mx is a “Proportional relationship”
Hence, from the above,
We can conclude that the best term from the box to complete the given definition is “Proportional relationship”
Question 3.
y-value at which a line of a graph crosses the y-axis is called the ___
Answer:
We know that,
y-value at which a line of a graph crosses the y-axis is called the “y-intercept”
Hence, from the above,
We can conclude that the best term from the box to complete the given definition is “y-intercept”
Question 4.
An equation written in the form y = mx + b is called the ___
Answer:
We know that,
An equation written in the form y = mx + b is called the “Linear equation” or the “Slope-intercept form”
Hence, from the above,
We can conclude that the best term from the box to complete the given definition is “Linear equation”(or) the “Slope-intercept form”
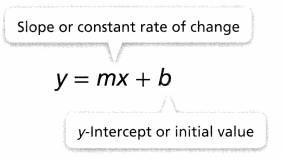
Slope and y-Intercept
Find the slope and y-intercept of a line that passes through these points.
Question 5.
(2, 2) and (3, 0)
Answer:
The given points are:
(2, 2), and (3, 0)
Compare the given points with (x1, y1), (x2,y2)
We know that,
Slope(m) = y2 – y1 / x2 – x1
So,
m = \(\frac{0 – 2}{3 – 2}\)
= \(\frac{-2}{1}\)
= -2
We know that,
The linear equation in the slope-intercept form is:
y = mx + c
Where,
m is the slope
c is the y-intercept
We know that,
We can obtain the y-intercept by putting the value of x equal to 0
So,
y = -2x + c
Substitute (3, 0) or (2, 2) in the above equation
So,
0 = -6 + c
So,
c = 6
Hence, from the above,
We can conclude that
The slope of a line that passes through the given points is: -2
The y-intercept of a line is: 6
Question 6.
(1, 5) and (4, 10)
Answer:
The given points are:
(1, 5), and (4, 10)
Compare the given points with (x1, y1), (x2,y2)
We know that,
Slope(m) = y2 – y1 / x2 – x1
So,
m = \(\frac{10 – 5}{4 – 1}\)
= \(\frac{5}{3}\)
We know that,
The linear equation in the slope-intercept form is:
y = mx + c
Where,
m is the slope
c is the y-intercept
We know that,
We can obtain the y-intercept by putting the value of x equal to 0
So,
y = \(\frac{5}{3}\)x + c
Substitute (4, 10) or (1, 5) in the above equation
So,
5 = \(\frac{5}{3}\) + c
So,
c = \(\frac{10}{3}\)
Hence, from the above,
We can conclude that
The slope of a line that passes through the given points is: \(\frac{5}{3}\)
The y-intercept of a line is: \(\frac{10}{3}\)
Question 7.
(8, 2) and (-8,6)
Answer:
The given points are:
(8, 2), and (-8, 6)
Compare the given points with (x1, y1), (x2,y2)
We know that,
Slope(m) = y2 – y1 / x2 – x1
So,
m = \(\frac{6 – 2}{-8 – 8}\)
= \(\frac{4}{-16}\)
= –\(\frac{1}{4}\)
We know that,
The linear equation in the slope-intercept form is:
y = mx + c
Where,
m is the slope
c is the y-intercept
We know that,
We can obtain the y-intercept by putting the value of x equal to 0
So,
y = –\(\frac{1}{4}\)x + c
Substitute (-8, 6) or (8, 2) in the above equation
So,
2 = –\(\frac{1}{4}\) (8) + c
So,
c = 4
Hence, from the above,
We can conclude that
The slope of a line that passes through the given points is: –\(\frac{1}{4}\)
The y-intercept of a line is: 4
Compare Proportional Relationships
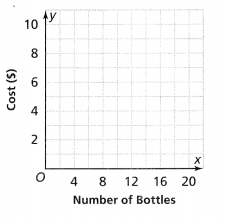
Jenna’s mother is shopping for energy drinks in 12-ounce bottles for Jenna’s soccer team. Store A sells a case of 18 bottles for $10. Store B sells a case of 12 bottles for $6. Which store sells the drinks for less? Use the graph to compare the unit costs of the drinks.
Question 8.
Answer:
Jenna’s mother is shopping for energy drinks in 12-ounce bottles for Jenna’s soccer team. Store A sells a case of 18 bottles for $10. Store B sells a case of 12 bottles for $6
Now,
The unit cost rate of a bottle in store A = \(\frac{The cost of 18 bottles}{18}\)
= \(\frac{$10}{18}\)
= $0.55
The unit cost rate of a bottle in store B = \(\frac{The cost of 12 bottles}{12}\)
= \(\frac{$6}{12}\)
= $0.5
So,
The representation of the unit cost rate of a bottle in both stores is:
So,
From the above graph,
We can observe that
The unit cost rate of a bottle in store B < The unit cost rate of a bottle in store A
Hence, from the above,
We can conclude that store B sells the drinks for less cost
Linear Equations
Question 9.
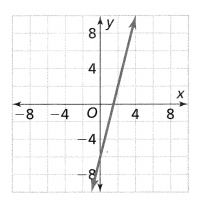
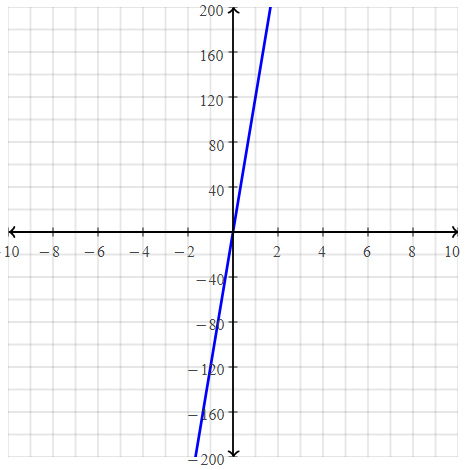
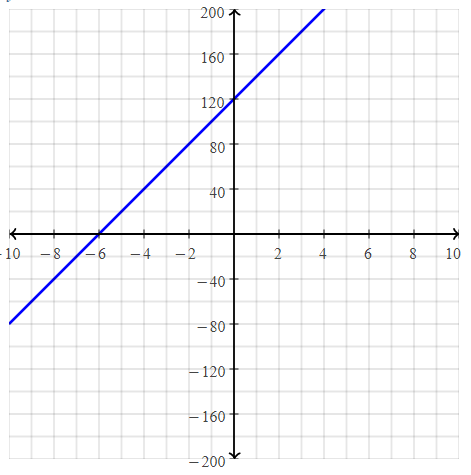
Write the equation for the graph of the line shown.
Answer:
The given graph is:
We know that,
The y-intercept is the value of the point that passes through the y-axis
So,
From the graph,
The point that passes through the y-axis is: (0, -6)
So,
The y-intercept is: -6
Now,
To find the slope,
The points are: (2, 2), and (0, -6)
Now,
Compare the given points with (x1, y1), (x2,y2)
We know that,
Slope(m) = y2 – y1 / x2 – x1
So,
m = \(\frac{-6 – 2}{0 – 2}\)
= \(\frac{-8}{-2}\)
= 4
We know that,
The linear equation in the slope-intercept form is:
y = mx + c
So,
y = 4x – 6
Hence, from the above,
We can conclude that the equation of the line for the given graph is:
y = 4x – 6
Language Development
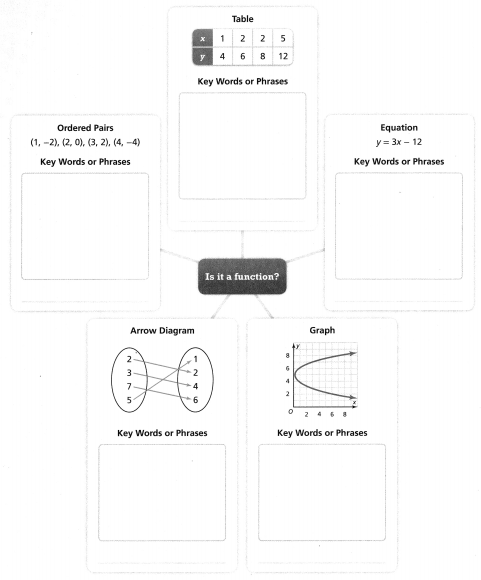
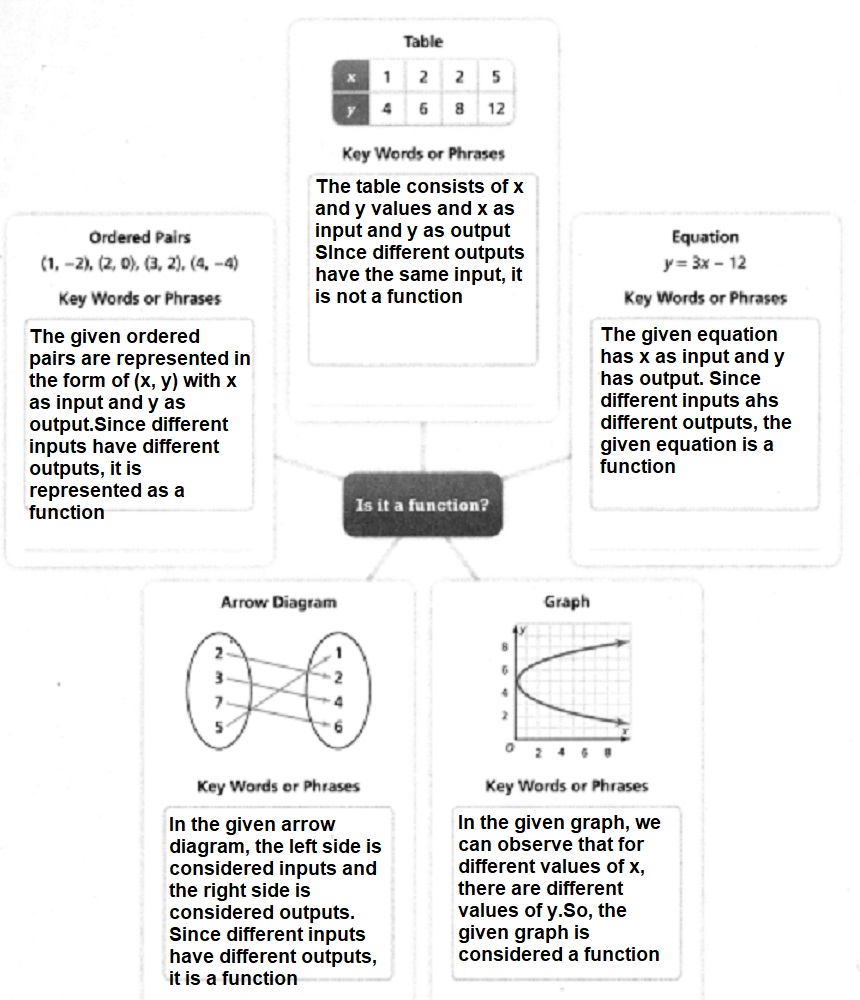
Write key words or phrases associated with each representation. Then write function or not a function on the given lines.
Answer:
Topic 3 PICK A PROJECT
PROJECT 3A

What machine could be invented to make your life better?
PROJECT: BUILD A RUBE GOLDBERG MACHINE
PROJECT 3B

What games can you play indoors?
PROJECT: MAKE A MATH
CARD GAME
PROJECT 3C
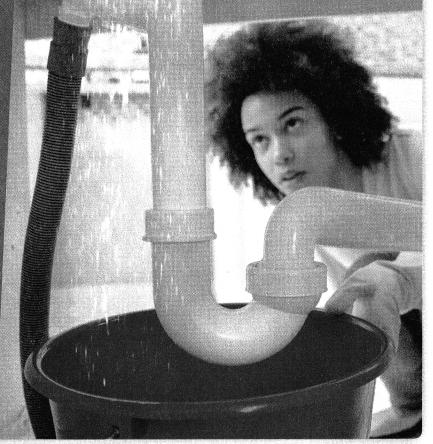
What are the steps for fixing a leaky pipe?
PROJECT: PLAN A MAINTENANCE ROUTE
PROJECT 3D

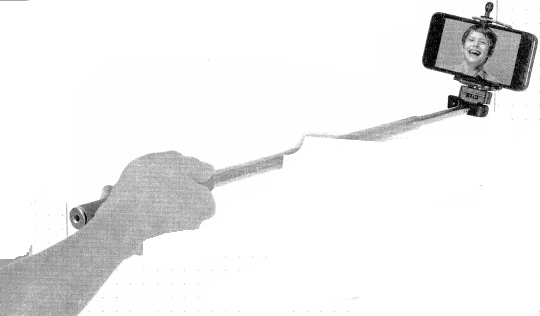
If you were to make a video game, what kind of game would it be?
PROJECT: DESIGN A VIDEO GAME ELEMENT
Lesson 3.1 Understand Relations and Functions
Solve & Discuss It!
The 10 members of Photography Club want to raise $500, so they will hold a raffle with donated prizes. Jesse proposes that to reach their goal, each member should sell 50 raffle tickets. Alexis proposes that each member should raise $50.
Whose plan would you recommend? Explain.
RAFFLE TICKETS
$1 1 ticket
$5 6 tickets
$20 25 tickets
Answer:
It is given that
The 10 members of the Photography Club want to raise $500, so they will hold a raffle with donated prizes. Jesse proposes that to reach their goal, each member should sell 50 raffle tickets. Alexis proposes that each member should raise $50.
It is also given that
$1 – 1 ticket
$5 – 6 tickets
$20 – 25 tickets
Now,
According to Jesse’s goal,
Each member should sell 50 raffle tickets to make the total amount of $500
The possible combinations may be:
50 $1 tickets will be sold by each member
Any other combination is not possible
According to Alexis’s plan,
Each member should raise $50 to make the total amount of $500
It is possible and very easy because $50 by each member can be raised in many ways
Hence, from the above,
We can conclude that Alexis’s plan would be recommended
Focus on math practices
Reasoning How are the two plans different? How are they similar?
Answer:
According to Jesse’s goal,
Each member should sell 50 raffle tickets to make the total amount of $500
The possible combinations may be:
50 $1 tickets will be sold by each member
Any other combination is not possible
Now,
According to Alexis’s plan,
Each member should raise $50 to make the total amount of $500
It is possible and very easy because $50 by each member can be raised in many ways
? Essential Question
when is a relation a function?
Answer:
A “Relation” from a set X to a set Y is called a “Function” if and only if each element of X is related to exactly one element in Y.
Try It!
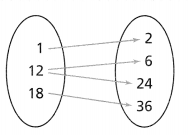
Joe needs to advertise his company. He considers several different brochures of different side lengths and areas. He presents the data as ordered pairs (side length, area).
(4, 24), (5, 35), (8, 24), (2, 20), (9, 27)
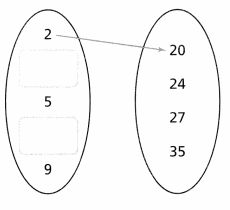
Complete the arrow diagram. Is the area of a brochure a function of the side length? Explain.
Answer:
Joe needs to advertise his company. He considers several different brochures of different side lengths and areas. He presents the data as ordered pairs (side length, area).
(4, 24), (5, 35), (8, 24), (2, 20), (9, 27)
We know that,
The ordered pairs can be represented in the form of (x, y)
Where,
x is the input
y is the output
Now,
From the given ordered pairs,
We can observe that for different values of the input, there are different values of output
Note:
If there are the same outputs for the different inputs, then also a relationship is considered a function
So,
The complete arrow diagram for the given ordered pairs are:
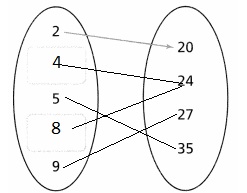
Hence, from the above,
We can conclude that the area of the brochure is a function of the side length
Convince Me!
There are two outputs of 24. Does this help you determine whether the relation is a function? Explain.
Answer:
We know that,
If there are the same outputs for the different inputs, then also a relationship is considered a function
Hence, from the above
We can conclude that even for the two outputs of 24, the given relationship is considered a function
Try It!
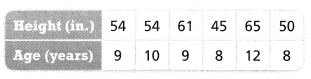
Frank reverses the ordered pairs to show the heights and ages of the same six students. Is age a function of height? Explain.
Answer:
It is given that
Frank reverses the ordered pairs to show the heights and ages of the same six students.
Now,
The given table is:
Now,
From the given table,
We can observe that
For different values of age, there are different values of height
Where,
Age —-> Input
Height —> Output
Hence, from the above,
We can conclude that age is a function of height
Try It!
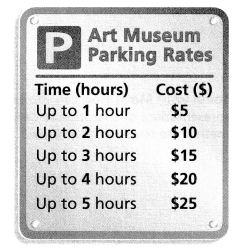
Heather claims that she can tell exactly how long a family was at the museum by how much the family pays for parking. Is Heather correct? Explain.
Answer:
It is given that
Heather claims that she can tell exactly how long a family was at the museum by how much the family pays for parking.
Now,
The table for the given situation is: (Example 3)
Now,
From the table,
We can observe that
There are different costs for the different times in hours
So,
We can say that cost is a function of time
Hence, from the above,
We can conclude that Heather’s claim is correct
KEY CONCEPT
A relation is a function if each input corresponds to exactly one output. You can use an arrow diagram or a table to determine whether a relation is a function.
This relation is a function.
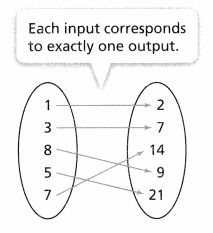
This relation is not a function.
Do You Understand?
Question 1.
? Essential Question
when is a relation a function?
Answer:
A relation from a set X to a set Y is called a function if and only if each element of X is related to exactly one element in Y
Question 2.
Model with Math
How can you use different representations of a relation to determine whether the relation is a function?
Answer:
Relations can be displayed as a table, a mapping, or a graph. In a table, the x-values and y-values are listed in separate columns. Each row represents an ordered pair: Displaying a relation as a table
Question 3.
Generalize
Is a relation always a function? Is a function always a relation? Explain.
Answer:
All functions are relations, but not all relations are functions. A function is a relation that for each input, there is only one output. Here are mappings of functions. The domain is the input or the x-value, and the range is the output or the y-value.
Question 4.
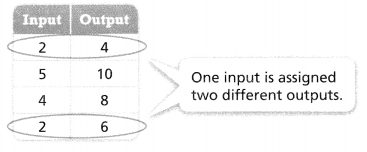
Is the relation shown below a function? Explain.
Answer:
The given relation is:
From the given relation,
We can observe that there is the same input for the different outputs,
We know that,
A relation can be considered as a function when the different inputs have different outputs
Hence, from the above,
We can conclude that the given relation is not a function
Question 5.
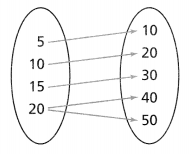
Is the relation shown below a function? Explain.
Answer:
The given relation is:
From the given relation,
We can observe that there are different outputs for different inputs
We know that,
A relation can be considered as a function when the different inputs have different outputs
Hence, from the above,
We can conclude that the given relation is a function
Question 6.
Is the relation shown below a function? Explain.
(4,16), (5, 25), (3,9), (6, 36), (2, 4), (1, 1)
Answer:
The given relation is:
(4,16), (5, 25), (3,9), (6, 36), (2, 4), (1, 1)
From the given relation,
We can observe that there are different outputs for different inputs
We know that,
A relation can be considered as a function when the different inputs have different outputs
Hence, from the above,
We can conclude that the given relation is a function
Practice & Problem Solving
Question 7.
The set of ordered pairs (1, 19), (2, 23), (3, 23), (4, 29), (5, 31) represents the number of tickets sold for a fundraiser. The input values represent the day and the output values represent the number of tickets sold on that day.
a. Make an arrow diagram that represents
Answer:
The arrow diagram for the given relation is:
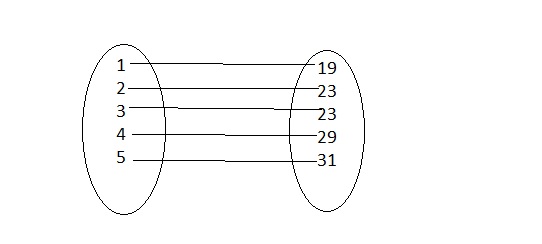
b. is the relation a function? Explain.
Answer:
It is given that
The set of ordered pairs (1, 19), (2, 23), (3, 23), (4, 29), (5, 31) represents the number of tickets sold for a fundraiser. The input values represent the day and the output values represent the number of tickets sold on that day.
Now,
The given relation is:
(1, 19), (2, 23), (3, 23), (4, 29), (5, 31)
From the given relation,
We can observe that there are different outputs for different inputs
We know that,
A relation can be considered as a function when the different inputs have different outputs
Hence, from the above,
We can conclude that the given relation is a function
Question 8.
Does the relation shown below represent a function? Explain.
(-2, 2), (-7, 1), (-3, 9), (3, 4), (-9,5), (-6, 8)
Answer:
The given relation is:
(-2, 2), (-7, 1), (-3, 9), (3, 4), (-9,5), (-6, 8)
From the given relation,
We can observe that there are different outputs for different inputs
We know that,
A relation can be considered as a function when the different inputs have different outputs
Hence, from the above,
We can conclude that the given relation is a function
Question 9.
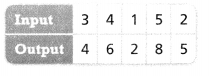
Is the relation shown in the table a function? Explain.
Answer:
The given relation is:
From the given relation,
We can observe that there are different outputs for the same inputs
We know that,
A relation can be considered as a function when the different inputs have different outputs
Hence, from the above,
We can conclude that the given relation is not a function
Question 10.
Construct Arguments
During a chemistry experiment, Sam records how the temperature changes over time using ordered pairs (time in minutes, temperature in °C).
(0, 15), (5, 20), (10,50) (15, 80). (20, 100), (25, 100) Is the relation a function? Explain.
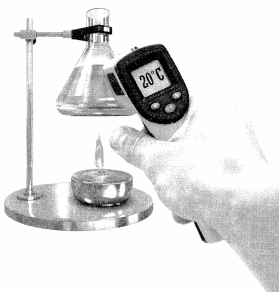
Answer:
It is given that
During a chemistry experiment, Sam records how the temperature changes over time using ordered pairs (time in minutes, temperature in °C).
(0, 15), (5, 20), (10,50) (15, 80). (20, 100), (25, 100)
We know that,
An ordered pair can be represented as (x, y)
Where,
x is the time
y is the temperature in °C
Now,
The given relation is:
(0, 15), (5, 20), (10,50) (15, 80). (20, 100), (25, 100)
From the given relation,
We can observe that there are different outputs for the different inputs
We know that,
A relation can be considered as a function when the different inputs have different outputs
Hence, from the above,
We can conclude that the given relation is a function
Question 11.
Reasoning
Taylor has tracked the number of students in his grade since third grade. He records his data in the table below. Is the relation a function? Explain.
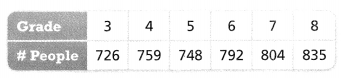
Answer:
It is given that
Taylor has tracked the number of students in his grade since third grade. He records his data in the table
Now,
The given table is:
From the given table,
We can observe that there are different outputs (People) for the different inputs (Grade)
We know that,
A relation can be considered as a function when the different inputs have different outputs
Hence, from the above,
We can conclude that the given table is a function
Question 12.
James raises chickens. He tracks the number of eggs his chickens lay at the end of each week. Is this relation a function? Explain.
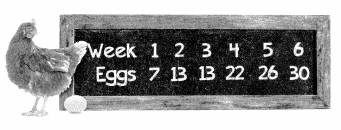
Answer:
It is given that
James raises chickens. He tracks the number of eggs his chickens lay at the end of each week
Now,
The given relation is:
From the given relation,
We can observe that there are different outputs (Eggs) for the different inputs (Weeks)
We know that,
A relation can be considered as a function when the different inputs have different outputs
Hence, from the above,
We can conclude that the given relation is a function
Question 13.
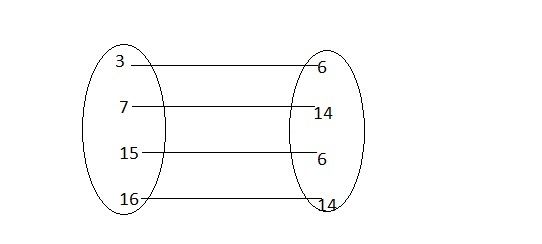
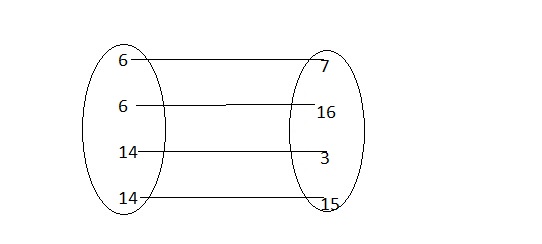
Relations P and Q are shown below.
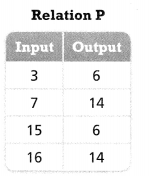
a. Make an arrow diagram to represent Relation P.
Answer:
The given relation is:
Hence,
The arrow diagram to represent the relation P is:
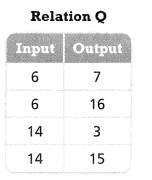
b. Make an arrow diagram to represent Relation Q.
Answer:
The given relation is:
Hence,
The arrow diagram to represent the relation Q is:
c. Which relation is a function? Explain.
Answer:
From relation P,
We can observe that there are different outputs for the different inputs
From relation Q,
We can observe that there are different outputs for the same inputs
Hence, from the above,
We can conclude that relation P is a function
Question 14.
Higher-Order Thinking
On a recent test, students had to determine whether the relation represented by the ordered pairs (1, 2), (6, 12), (12, 24), (18, 36) is a function. Bobby drew the arrow diagram on the right and said the relationship was not a function. What error did Bobby most likely make?
Answer:
It is given that
On a recent test, students had to determine whether the relation represented by the ordered pairs (1, 2), (6, 12), (12, 24), (18, 36) is a function. Bobby drew the arrow diagram on the right and said the relationship was not a function.
Now,
From the given arrow diagram and ordered pairs,
We can observe that
In the arrow diagram, inputs and outputs are reversely represented
Hence, from the above,
We can conclude that the error Bobby most likely made is the reversal of inputs and outputs
Assessment Practice
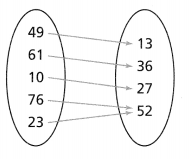
Question 15.
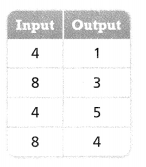
Write the set of ordered pairs that is represented by the arrow diagram at the right. Is the relation a function? Explain.
Answer:
The given arrow diagram is:
In the arrow diagram,
The left side represented the inputs and the right side represented the outputs
So,
The representation of the arrow diagram in the form of the ordered pairs (Input, Output) are:
(49, 13), (61, 36), (10, 27), (76, 52), (23, 52)
From the above relation,
We can observe that there are different outputs for the different inputs
We know that,
A relation can be considered as a function when the different inputs have different outputs
Hence, from the above,
We can conclude that the given relation is a function
Question 16.
Which of these relations are functions? Select all that apply.
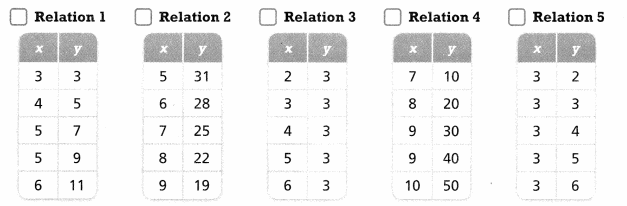
Answer:
We know that,
A relation can be considered as a function when the different inputs have different outputs
So,
From the given relations,
Relation 2, Relation 3 are the functions
Hence, from the above,
We can conclude that Relation 2 and Relation 3 are the functions
Lesson 3.2 Connect Representations of Functions
Solve & Discuss It!
Eliza volunteers at a nearby aquarium, where she tracks the migratory patterns of humpback whales from their feeding grounds to their breeding grounds. She recorded the distance, in miles, traveled by the whales each day for the first 7-day period of their migration. Based on Eliza’s data, how long will it take the humpback whales to travel the 3,100 miles to their breeding grounds?
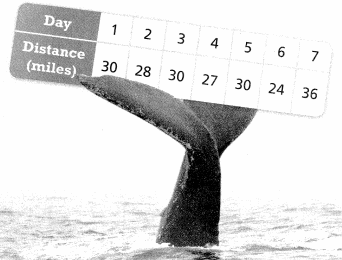
Focus on math practices
Construct Arguments How does finding an average distance the whales travel in miles help with finding a solution to this problem?
? Essential Question
What are different representations of a function?
Answer:
Relationships and functions can be represented as graphs, tables, equations, or verbal descriptions. Each representation gives us certain information. A table of values, mapping diagram, or set of ordered pairs gives us a list of input values and their corresponding output values.
Try It!
As the pump is pumping water, the amount of water in the pool decreases at a constant rate. Complete the statements below. Then graph the function.
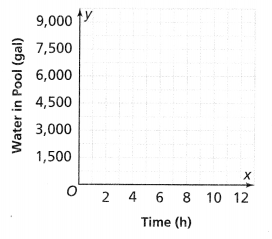
The amount of water remaining in the pool is ![]() gallons.
gallons.
The amount of water pumped each hour is ![]() gallons.
gallons.
The equation is ![]()
Answer:
It is given that
As the pump is pumping water, the amount of water in the pool decreases at a constant rate
Now,
Let the initial amount of water present in the pool is: 9,000 gallons
So,
The rate of the amount of water that pumped each hour = \(\frac{The initial amount of water present in the pool}{The time that is present where the initial amount of water present}\)
= \(\frac{9,000}{12}\)
= 750 gallons per hour
So,
The amount of water remaining in the pool = The initial amount of water present in the pool – The amount of water that pumped each hour
= 9,000 – 1,500
= 7,500 gallons
Let the number of hours be x
We know that,
The linear equation is in the form of
y = mx + c
So,
The total amount of water present in the pool = The rate at which the water pumps out + The amount of water that pumped each hour
9,000 = 750x + 7,500
Hence, from the above,
We can conclude that
The amount of water remaining in the pool is 7,500 gallons.
The amount of water pumped each hour is 1,500 gallons.
The equation is:
9,000 = 750x + 7,500
Convince Me!
How is the rate of change of this function different from that in Example 1? Explain.
Answer:
The rate of change of the function present in Example 1 is increasing at a constant rate whereas the rate of change of the function in this situation is decreasing at a constant rate
Try It!
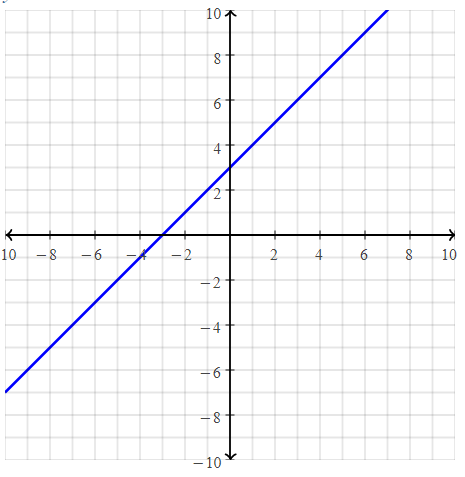
Draw a graph that represents a linear function?
Answer:
We know that,
The representation of the linear equation is:
y = mx —–> Slope form
y = mx + c —-> Slope-intercept form
Now,
Let the linear equation in the slope-intercept form be:
y = x + 3
Hence,
The graph of the above linear equation in the coordinate plane is:
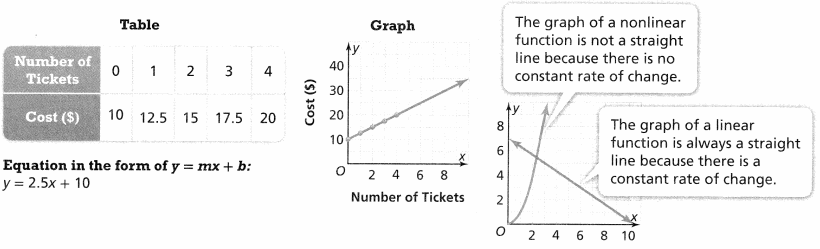
KEY CONCEPT
You can represent a function in different ways: in a table, in a graph, or as an equation.
A day at the amusement park costs $10 for an entrance fee and $2.50 for each ride ticket.
Do You Understand?
Question 1.
?Essential Question What are different representations of a function?
Answer:
Relationships and functions can be represented as graphs, tables, equations, or verbal descriptions. Each representation gives us certain information. A table of values, mapping diagram, or set of ordered pairs gives us a list of input values and their corresponding output values.
Question 2.
Use Appropriate Tools How can you use a graph to determine that a relationship is NOT a function?
Answer:
Use the vertical line test to determine whether or not a graph represents a function. If a vertical line is moved across the graph and, at any time, touches the graph at only one point, then the graph is a function. If the vertical line touches the graph at more than one point, then the graph is not a function.
Question 3.
Construct Arguments Must the ordered pairs of a function be connected by a straight line or a curve on a graph? Explain.
Answer:
The points can be connected by a straight line. Thus, the ordered pairs represent a linear function.
Do You Know How?
Question 4.
Each week, Darlene tracks the number of party hats her company has in stock. The table shows the weekly stock. Is the relationship a linear function? Use the graph below to support your answer.
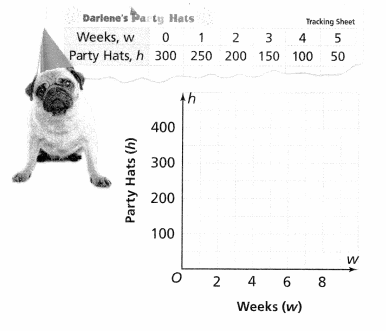
Answer:
It is given that
Each week, Darlene tracks the number of party hats her company has in stock. The table shows the weekly stock.
We know that,
A relation is defined as a function only when there are different outputs for different inputs
Now,
From the given table,
We can observe that the outputs (party hats) are different for different inputs (Weeks)
Now,
The given function can be called “Linear function” if the rate of change is constant
The given function can be called a “Non-linear function” if the rate of change is not constant
Now,
The rate of change = Initial value – Next value
Hence, from the above,
We can conclude that the given relationship is a linear function
Question 5.
How can Darlene use the graph above to know when to order more party hats?
Answer:
From the graph,
Darlene know when to order more hats when there is no stack when observing the track sheet
Practice & Problem Solving
Leveled Practice In 6-7, explain whether each graph represents a function.
Question 6.
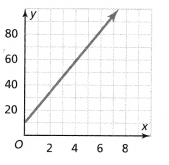
Answer:
The given graph is:
From the above graph,
We can observe that each input has a different output and the rate of change is constant
Hence, from the above,
We can conclude that the given graph represents a function
Question 7.
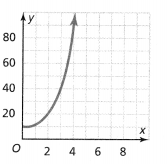
Answer:
The given graph is:
From the given graph,
We can observe that each input has a different output but the rate of change is not constant
Hence, from the above,
We can conclude that the given graph represents a function but a non-linear function
Question 8.
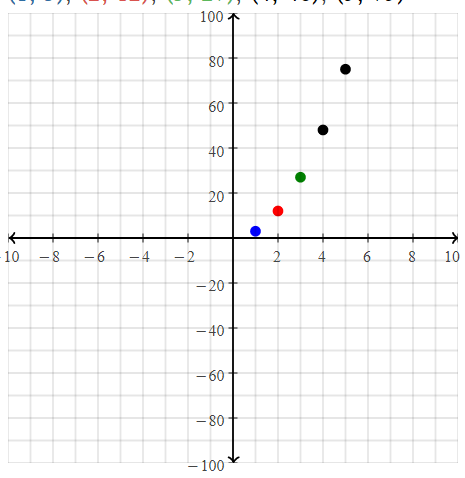
Hannah approximates the areas of circles using the equation A = 3r2 and records areas of circles with different radius lengths in a table.
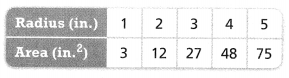
a. Graph the ordered pairs from the table.
Answer:
The given table is:
So,
From the table,
The representation of the ordered pairs (in, in²) are:
(1, 3), (2, 12), (3, 27), (4, 48), (5, 75)
Hence,
The representation of the ordered pairs in the coordinate plane is:
b. Is the relation a function? Explain.
Answer:
From part (a),
We can observe that there are different outputs for different inputs
Hence, from the above,
We can conclude that the given relation is a function
Question 9.
Model with Math
The relationship between the number of hexagons, x, and the perimeter of the figure they form, y, is shown in the graph. is the perimeter of the figure a function of the number of hexagons? Explain.
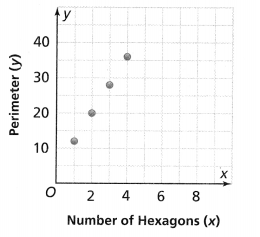
Answer:
It is given that
The relationship between the number of hexagons, x, and the perimeter of the figure they form, y, is shown in the graph
Now,
From the graph,
We can observe that for different values of perimeters, the number of hexagons is also different
Hence, from the above,
We can conclude that the perimeter of a figure is a function of the number of hexagons
Question 10.
Construct Arguments Do the ordered pairs plotted in the graph below represent a function? Explain.

Answer:
The given graph is:
From the given graph,
We can observe that for the different values of x, there are different values of y
Hence, from the above,
We can conclude that the given ordered pairs in the graph represents a function
Question 11.
A train leaves the station at time t = 0. Traveling at a constant speed, the train travels 360 kilometers in 3 hours.
a. Write a function that relates the distance traveled, d, to the time, t.
Answer:
It is given that
A train leaves the station at time t = 0. Traveling at a constant speed, the train travels 360 kilometers in 3 hours.
We know that,
Speed = \(\frac{Distance}{Time}\)
Here,
Speed is constant
So,
Distance = m (Time)
d = mt
Where,
m is the rate of change or proportionality constant
Now,
m = \(\frac{Distance}{Time}\)
= \(\frac{360}{3}\)
= 120 km / hour
Hence, from the above,
We can conclude that the function that relates to the distance d, and time t is:
d = 120t
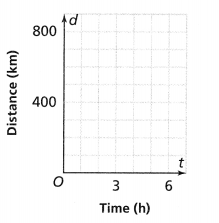
b. Graph the function and tell whether it is a linear function or a nonlinear function.
The function is a ![]() function.
function.
Answer:
From part (a),
The function that relates the distance d, and time t is:
d = 120t
Now,
Compare the above equation with y = mx
Hence,
The graph of the above function is:
Hence, from the above,
We can conclude that the given function is a linear function from the above graph
Question 12.
Higher-Order Thinking Tell whether each graph is a function and justify your answer. Which graph is not a good representation of a real-world situation? Explain.
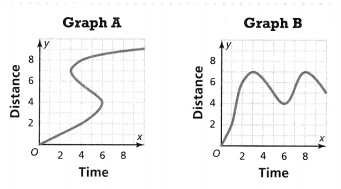
Answer:
The given graphs are:
From graph A,
We can observe that there are different outputs for the same input
So,
Graph A does not represent the function
From graph B,
We can observe that there are different outputs for the different inputs
So,
Graph B does represent a function
Hence, from the above,
We can say that graph A does not represent the real-world situation
Assessment Practice
Question 13.
You have an ant farm with 22 ants. The population of ants on your farm doubles every 3 months.
PART A
Complete the table.
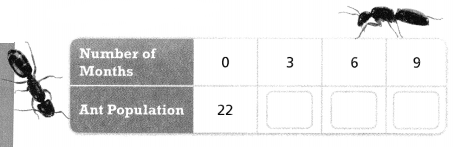
Answer:
It is given that
You have an ant farm with 22 ants. The population of ants on your farm doubles every 3 months.
Hence,
The completed table for the given situation is:
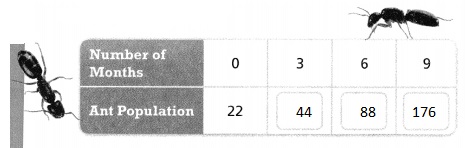
PART B
Is the relation a function? If so, is it a linear function or a nonlinear function? Explain.

Answer:
From part (a),
We can observe that the ant population is different for the different number of months
Now,
Rate of change = \(\frac{44}{22}\)
= 2
So,
The rate of change is also constant for all the table
Hence, from the above,
We can conclude that the given relation is a linear function
Question 14.
Use the function y = \(\frac{3}{2}\)x + 3 to complete the table of values.
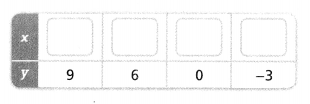
Answer:
The given function is:
y = \(\frac{3}{2}\)x + 3
Hence,
The completed table for the given values of y is:
Lesson 3.3 Compare Linear and Nonlinear Functions
Solve & Discuss It!
Two streaming video subscription services offer family plans with different monthly costs, as shown in the ads below. What do the two plans have in common? How are they different? When is Movies4You a better deal than Family Stream?

Answer:
It is given that
Two streaming video subscription services offer family plans with different monthly costs, as shown in the ads
Now,
Let the number of devices be x
Let the total subscription cost be y
So,
For Movies 4 U,
The total subscription cost = The subscription cost of the first device + The subscription fee for additional devices
y = $10 + $2x
For Family Stream,
The total subscription cost = The subscription cost of the first device + The subscription fee for additional devices
y = \(\frac{$12}{4}\) + $1x
y = $3 + $1x
Now,
The above equations are in the form of slope-intercept form
We know that,
The slope-intercept form of the equation is:
y = mx + c
Now,
The common points in the two plans are:
A) The subscription cost of the first device plan
B) The additional fee plan
The different points in the two plans are:
A) The first plan consists of the additional fee of each device
B) The second plan consists of the additional fee for greater than 5 devices
Now,
Movies 4 U is better than Family Stream when the subscription cost of the first device will be less
Model with Math
How can you represent the relationship between cost and number of devices?
Answer:
The representation of the relationship between the cost and the number of devices is:
The total subscription cost = The subscription cost of the first device + The subscription fee for additional devices
Focus on math practices
Look for Relationships Describe the relationship between the cost and the number of devices for each service. What do you notice about each relationship?
Answer:
The relationship between the cost and the number of devices for each service is:
The total subscription cost = The subscription cost of the first device + The subscription fee for additional devices
In the service of Family Stream,
The subscription fee is given for up to 4 devices and the additional subscription fee is for greater than 5 devices
? Essential Question
How can you compare two functions?
Answer:
The two functions can be compared by:
A) Identify the rate of change for the first function
B) Identify the rate of change for the second function
C) Identify the y-intercept of the first function
D) Identify the y-intercept of the second function
E) Compare the properties of each function
Try It!
The welding rate of a third robot is represented by the equation t = 10.8w, where t represents the time in minutes and w represents the number of welding tasks. How does it compare to the other two?
Answer:
It is given that
The welding rate of a third robot is represented by the equation t = 10.8w, where t represents the time in minutes and w represents the number of welding tasks (Refer to Example 1)
Now,
For a third robot,
The wielding rate = \(\frac{The number of wielding tasks (w)}{Time in minutes (t)}\)
= 10.8 (From the equation t = 10.8w)
Now,
When we compare the wielding rates of the three robots,
The wielding rate of the first robot (10.4) < The wielding rate of the third robot (10.8) < The wielding rate of the second robot (11.2)
Hence, from the above,
We can conclude that the comparison of the wielding rates of the three robots is:
The first robot’s wielding rate < The third robot’s wielding rate < The second robot’s wielding rate
Convince Me!
How can linear equations help you compare linear functions?
Answer:
While all linear equations produce straight lines when graphed, not all linear equations produce linear functions. In order to be a linear function, a graph must be both linear (a straight line) and a function (matching each x-value to only one y-value).
Try It!
Compare the properties of these two linear functions.
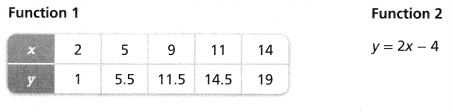
Answer:
The given functions are:
Now,
For function 1,
Find out the rate of change and the y-intercept i.e., the initial value
We know that,
Rate of change = \(\frac{y}{x}\)
Now,
For y = 1 and x = 2.
Rate of change = 0.5
For y = 5.5 and x = 5,
Rate of change = 1.1
SO,
From the above values,
We can say that the rate of change is not constant
So,
The given function is a non-linear function and it does not have any initial value i.e., the y-intercept is 0
Now,
For function 2,
Compare the given equation with
y = mx + c
Where,
m is the slope or the rate of change
c is the initial value or the y-intercept
So,
From the given equation,
Rate of change (m): 2
The y-intercept is: -4
Hence, from the above 2 functions,
We can conclude that
The y-intercept of function1 > The y-intercept of function 2
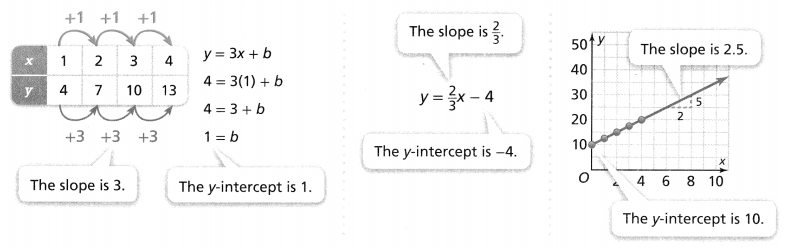
KEY CONCEPT
You can compare functions in different representations by using the properties of functions.
Compare the constant rate of change and the initial value.
Do You Understand?
Question 1.
? Essential Question
How can you compare two functions?
Answer:
The two functions can be compared by:
A) Identify the rate of change for the first function
B) Identify the rate of change for the second function
C) Identify the y-intercept of the first function
D) Identify the y-intercept of the second function
E) Compare the properties of each function
Question 2.
Reasoning Anne is running on a trail at an average speed of 6 miles per hour beginning at mile marker 4. John is running on the same trail at a constant speed, shown in the table. How can you determine who is running faster?
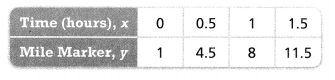
Answer:
It is given that
Anne is running on a trail at an average speed of 6 miles per hour beginning at mile marker 4. John is running on the same trail at a constant speed, shown in the table.
So,
For Anne,
The rate of change is defined as the average speed
The y-intercept is defined as the beginning point
Hence,
For Anne,
The rate of change is: 6 miles per hour
The y-intercept is: 4
Now,
The given table is:
From the given table,
For John,
Rate of change = \(\frac{y}{x}\) = \(\frac{Mile marker}{Time (hours)}\)
Now,
The total distance traveled by John (y) = Final value – Initial value
= 11.5 – 1
= 10.5 miles
The total time took by John (x) = 1.5 hours
So,
Rate of change = \(\frac{y}{x}\)
= \(\frac{10.5}{1.5}\)
= 7 miles per hour
Now,
We know that,
The y-intercept is the value of y when x = 0
So,
The y-intercept is: 1
Hence, from the above,
By comparing the values of the rate of change,
We can conclude that John is running faster
Question 3.
Reasoning In Item 2, how do Anne and John’s starting positions compare? Explain.
Answer:
We know that,
The starting positions are nothing but the initial positions of both Anne and John i.e., the y-intercepts of both Anne and John
So,
The y-intercept of Anne is: 4
The y-intercept of John is: 1
Hence, from the above,
By comparing the y-intercepts,
We can conclude that
The starting position of Anne > The starting position of John
Do You Know How?
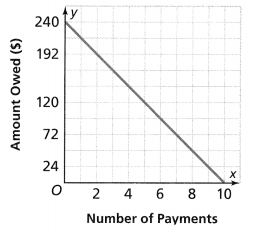
Felipe and Samantha use a payment plan to buy musical instruments. Felipe writes the equation y = -30x + 290 to represent the amount owed, y, after x payments. The graph shows how much Samantha owes after each payment.
Answer:
It is given that
Felipe and Samantha use a payment plan to buy musical instruments. Felipe writes the equation y = -30x + 290 to represent the amount owed, y, after x payments. The graph shows how much Samantha owes after each payment.
Now,
Compare the given equation with
y = mx + c
Where,
m is the rate of change
c is the initial value or the y-intercept
So,
From the given equation
For Felipe,
The rate of change is: -30
The initial value is: 290
Now,
The given graph is:
For Samantha,
From the given graph,
The initial value is: 240
The rate of change = \(\frac{Any value of y}{The value of x that corresponds to the value of y}\)
= \(\frac{120}{6}\)
= 20
Question 4.
Whose musical instrument costs more, Felipe’s or Samantha’s? Explain.
Answer:
We know that,
If the amount owed (y) is less i.e, the rate of change is negative, then the cost of the instrument will also be less
So,
When we compare the rate of change of Felip and Samantha,
The rate of change of Felip < The rate of change of Samantha
Hence, from the above comparison,
We can conclude that the instrument of Samantha costs more
Question 5.
Who will pay more each month? Explain.
Answer:
When we compare the rate of change of Felip and Samantha,
The rate of change of Felip < The rate of change of Samantha
Hence, from the above comparison,
We can conclude that Samantha will pay more each month
Practice & Problem Solving
Question 6.
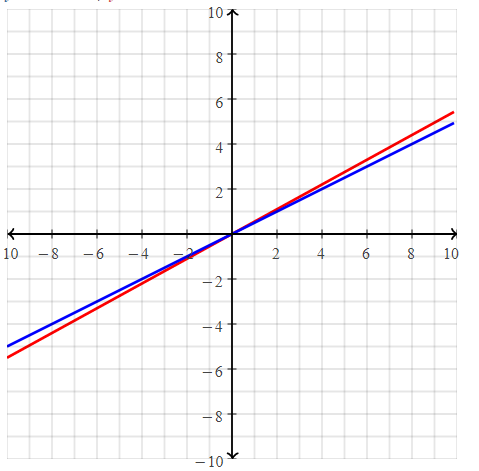
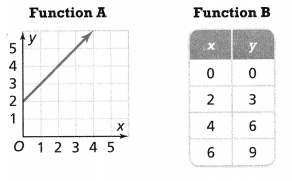
Two linear functions are shown below. Which function has the greater rate of change?
Answer:
The given linear functions are:
We know that,
The rate of change = \(\frac{y}{x}\)
So,
For Function A,
The rate of change = \(\frac{Any value of y}{The value of x that corresponds to y}\)
= \(\frac{4}{2}\)
= 2
For Function B,
The rate of change = \(\frac{y}{x}\)
= \(\frac{3}{2}\)
= 1.5
Hence, from the above,
We can conclude that Function A has a greater rate of change
Question 7.
Two linear functions are shown below. Which function has the greater initial value?
Answer:
The given functions are:
We know that,
The initial value is also known as the y-intercept
The y-intercept is the value of y when x = 0
So,
For Function A,
The initial value (y-intercept) is: 4
For function B,
Compare the given equation with
y = mx + c
Where,
m is the rate of change
c is the initial value or the y-intercept
So.
The initial value (y-intercept) is: 3
Hence, from the above,
We can conclude that Function A has the greater initial value
Question 8.
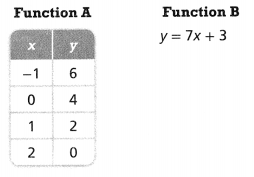
Tell whether each function is linear or nonlinear.
Answer:
The given functions are:
We know that,
To find whether the given function is linear or non-linear, we have to verify whether the rate of change is constant or not
If the rate of change is constant, then the function is linear
If the rate of change is not constant, then the function is non-linear
Now,
For Function A,
The rate of change = \(\frac{y}{x}\)
For x = 1 and y = 2,
The rate of change = 2
For x = 2 and y = 5,
The rate of change = 2.5
Hence,
Function A is a non-linear function
Now,
For Function B,
The rate of change = \(\frac{y}{x}\)
For x = 1 and y = 4,
The rate of change = 4
For x = 1.5 and y = 3,
The rate of change = 2
Hence,
Function B is a non-linear function
Question 9.
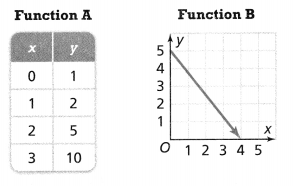
Tell whether each function is linear or nonlinear.
Answer:
The given functions are:
We know that,
For a relation to be a graph, each input has a different output but the same input will not have different outputs
Now,
From Function A,
We can observe that there are different inputs for different outputs i.e., the values of x and y are different
So,
The rate of change is not constant since the graph is non-linear
Hence,
Function A is a non-linear function
Now,
From Function B,
Compare the given equation with
y = mx + c
Where,
m = 1
c = 0
So,
The rate of change is constant for Function B
Hence,
Function B is a linear function
Question 10.
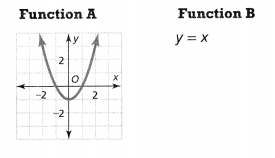
Determine whether each function is linear or nonlinear from its graph.
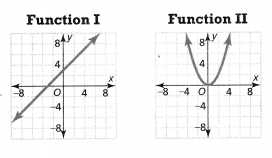
Answer:
The given graphs are:
We know that,
If the graph is a straight line, then the function is a linear function
If the graph is not a straight line, then the function is not a linear function
Hence, from the above,
We can conclude that
The function 1 is a linear function
The function 2 is a non-linear function
Question 11.
Look for Relationships Justin opens a savings account with $4. He saves $2 each week. Does a linear function or a nonlinear function represent this situation? Explain.
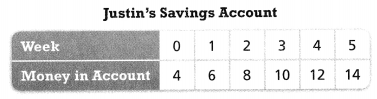
Answer:
It is given that
Justin opens a savings account with $4. He saves $2 each week.
Now,
The given table is:
From the given table,
We can observe that there is a constant rate of change
Now,
For weeks,
We can obtain the number of weeks by adding 1 i.e., 0 + 1, 1 + 1, etc
So,
The rate of change is constant i.e., 1
For money in account,
We can obtain the money by adding 2 to the initial amount of money i.e., 4 + 2, 6 + 2, etc
So,
The rate of change is constant i.e., 2
Hence, from the above,
We can conclude that since the rate of change is constant, the given situation represents a linear function
Question 12.
Reasoning The function y = 4x + 3 describes Player A’s scores in a game of trivia, where x is the number of questions answered correctly and y is the score. The function represented in the table shows Player B’s scores. What do the rates of change tell you about how each player earns points?
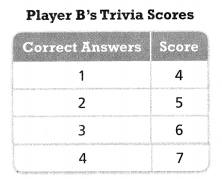
Answer:
It is given that
The function y = 4x + 3 describes Player A’s scores in a game of trivia, where x is the number of questions answered correctly and y is the score. The function represented in the table shows Player B’s scores.
Now,
For Player A,
The given equation is:
y = 4x + 3
Compare the givene quation with
y = mx + c
Where,
m is the rate of change
c is the y-intercept
So,
The rate of change of Player A is: 4
Now,
The given table is:
For Player B,
From the given table,
We can observe that the rate of change is constant for both the values of x and y
The rate of change for both the values of x and y is: 1
So,
The rate of change of Player B is: 1
So,
The rate of change of Player A > The rate of change of Player B
Hence, from the above,
We can conclude that Player A earns more points
Question 13.
Two athletes are training over a two-week period to increase the number of push-ups each can do consecutively. Athlete A can do 16 push-ups to start, and increases his total by 2 each day. Athlete B’s progress is charted in the table. Compare the initial values for each. What does the initial value mean in this situation?
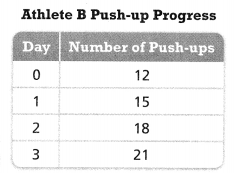
Answer:
It is given that
Two athletes are training over a two-week period to increase the number of push-ups each can do consecutively. Athlete A can do 16 push-ups to start, and increases his total by 2 each day. Athlete B’s progress is charted in the table
Now,
For Athlete A,
The starting point is: 16
So,
The initial point for Athlete A is: 16
Now,
For Athlete B,
The given table is:
We know that,
The initial point or the y-intercept is the value of y when x = 0
So,
The initial point for Athlete B is: 12
Hence, from the above,
We can conclude that
The initial points in the given situation describe the number of pushups one can do at a time without stop
The initial point for Athlete A > The initial point for Athlete B
Question 14.
Higher-Order Thinking The equation y = 4x – 2 and the table and graph shown at the right describe three different linear functions. Which function has the greatest rate of change? Which has the least? Explain.
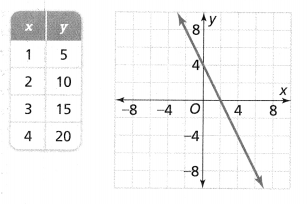
Answer:
It is given that
The equation y = 4x – 2 and the table and graph shown at the right describe three different linear functions
Now,
a)
The given equation is:
y = 4x – 2
Compare the given equation with
y = mx + c
Where,
m is the constant rate of change
So,
For the given equation,
The rate of change is: 4
b)
The given table and graph are:
Now,
From the given table,
The rate of change = \(\frac{y}{x}\)
For x = 1 and y = 5,
The rate of change is: 5
For x = 2 and y = 10
The rate of change is: 5
Now,
Since the rate of change is constant for all the cases,
The rate of change for the given table is: 5
Now,
From the given graph,
The given points to find the slope are: (0, 4), and (2, 0)
So,
Slope (or) The rate of change = \(\frac{0 – 4}{2 – 0}\)
= \(\frac{-4}{2}\)
= -2
Now,
When we compare the rate of change for all the three linear functions,
The rate of change of the table > The rate of change of the equation < The rate of change of the graph
Hence, from the above,
We can conclude that
The function that has the greatest rate of change is: Table
The function that has the least rate of change is: Graph
Assessment Practice
Question 15.
The students in the After-School Club ate 12 grapes per minute. After 9 minutes, there were 32 grapes remaining. The table shows the number of carrots remaining after different amounts of time. Which snack did the students eat at a faster rate? Explain.
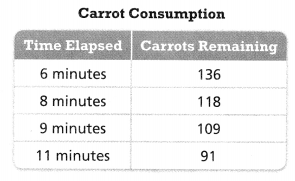
Answer:
It is given that
The students in the After-School Club ate 12 grapes per minute. After 9 minutes, there were 32 grapes remaining. The table shows the number of carrots remaining after different amounts of time.
Now,
The rate of change of grapes consumption is: 12 grapes per minute
Now,
The given table is:
Now,
The rate of change of carrots consumption = \(\frac{The difference between any 2 values of carrots remaining}{The values of the tie elapsed corresponding to the carrots remaining}\)
= \(\frac{118 – 136}{8 – 6}\)
= –\(\frac{18}{2}\)
= -9 carrots per minute
So,
The consumption rate of grapes > The consumption rate of carrots
Hence, from the baove,
We can conclude that grapes can be eaten at a faster rate
Question 16.
The height of a burning candle can be modeled by a linear function. Candle A has an initial height of 201 millimeters, and its height decreases to 177 millimeters after 4 hours of burning. The height, h, in millimeters, of Candle B, can be modeled by the function h = 290 – 5t, where t is the time in hours. Which of the following statements are true?
![]() The initial height of Candle A is greater than the initial height of Candle B.
The initial height of Candle A is greater than the initial height of Candle B.
![]() The height of Candle A decreases at a faster rate than the height of Candle B.
The height of Candle A decreases at a faster rate than the height of Candle B.
![]() Candle B will burn out in 58 hours.
Candle B will burn out in 58 hours.
![]() After 10 hours, the height of Candle A is 110 millimeters.
After 10 hours, the height of Candle A is 110 millimeters.
![]() Candle A will burn out before Candle B.
Candle A will burn out before Candle B.
Answer:
Let the given options be named as A, B, C, D, and E
It is given that
The height of a burning candle can be modeled by a linear function. Candle A has an initial height of 201 millimeters, and its height decreases to 177 millimeters after 4 hours of burning. The height, h, in millimeters, of Candle B, can be modeled by the function h = 290 – 5t, where t is the time in hours
Now,
The rate of change of Candle A = \(\frac{201 – 177}{4}\)
= \(\frac{24}{4}\)
= 6 millimeters per hour
Now,
For Candle B,
The time to burn the Candle B = \(\frac{290}{5}\)
= 58 hours
Hence, from the above,
We can conclude that B, C, and E match with the given situation
Topic 3 MID-TOPIC CHECKPOINT
Question 1.
Vocabulary How can you determine whether a relation is a function? Lesson 3.1
Answer:
Identify the output values. If each input value leads to only one output value, classify the relationship as a function. If any input value leads to two or more outputs, do not classify the relationship as a function.
Question 2.
Can an arrow or arrows be drawn from 10.3 so the relation in the diagram is a function? Explain your answer. Lesson 3.1
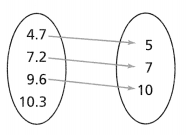
Answer:
The given diagram is:
For the relation in the diagram to be a function,
The arrows from the right side to the left side can be many but the arrows from the left side to the right side can only be one
Question 3.
Two linear functions are shown below. Which function has the greater rate of change? Justify your response. Lesson 3.3
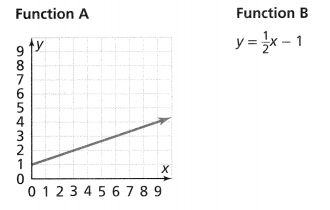
Answer:
The given linear functions are:
We know that,
For a linear function,
The rate of change is constant
So,
For Function A,
The rate of change = \(\frac{y}{x}\)
= \(\frac{3}{6}\)
= \(\frac{1}{2}\)
= 0.5
For Function B,
The given equation is:
y = \(\frac{1}{2}\)x – 1
y = 0.5x – 1
Compare the above equation with
y = mx + c
Where,
m is the rate of change
So,
The rate of change is: 0.5
Hence, from the above,
We can conclude that the two linear functions have the same rate of change
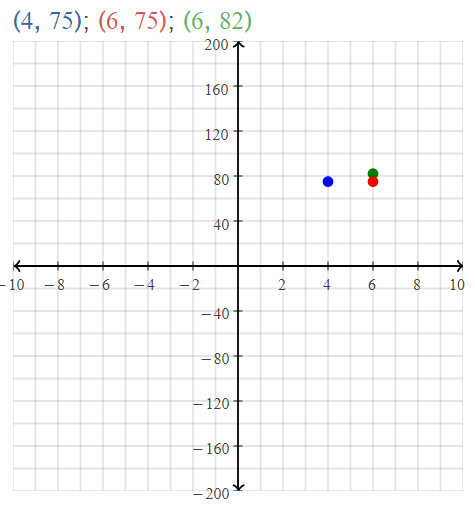
Question 4.
Neil took 3 math tests this year. The number of hours he spent studying for each test and the corresponding grades he earned is shown in the table. Is the relation of hours of study time to the grade earned on a test a function? Explain why. Use the graph to justify your answer. Lesson 3.2
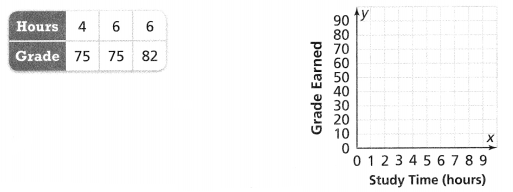
Answer:
It is given that
Neil took 3 math tests this year. The number of hours he spent studying for each test and the corresponding grades he earned is shown in the table.
Now,
For the number of hours as input and the Grades as the output,
We can observe that
For each value of the hours, there are the same values of the Grade
So,
The relation of hours of study time to the grade earned on a test is not considered a function
Now,
The representation of the relation in the form of the ordered pairs is:
(4, 75), (6, 75), and (6, 82)
Hence,
The representation of the ordered pairs in the coordinate plane is:
Question 5.
Is the function shown linear or nonlinear? Explain your answer. Lesson 3.3
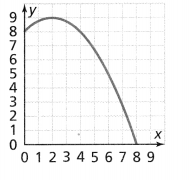
Answer:
The given graph is:
From the given graph,
We can observe that
For each value of x, there is only 1 value of y
So,
The given graph is a function
We know that,
A function is called a linear if the graph is a straight line
A function is called non-linear if the graph is in any shape other than the straight line
Hence, from the above,
We can conclude that the given graph is a non-linear function
How well did you do on the mid-topic checkpoint? Fill in the stars.
Topic 3 MID-TOPIC PERFORMANCE TASK
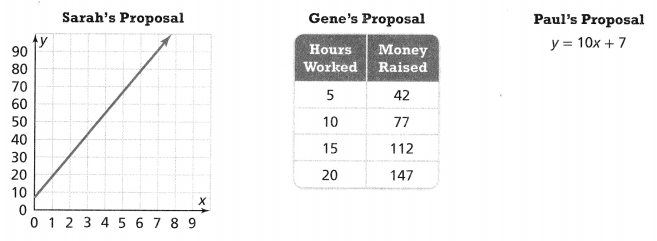
Sarah, Gene, and Paul are proposing plans for a class fundraiser. Each presents his or her proposal for the amount of money raised, y, for x number of hours worked, in different ways.
Answer:
The given graphs are:
Now,
a)
From the given graph,
We can observe that
For each value of x, there is only 1 value of y
The given graph is a straight line
Now,
The rate of change of the given graph = \(\frac{y}{x}\)
= \(\frac{0 – 10}{1 – 0}\)
= -10
Hence,
The given graph is considered a linear function
b)
From the given table,
To consider a function linear, verify whether the rate of change is constant or not
Now,
For all the values of x,
The rate of change is: 5
For all the values of y,
The rate of change is: 35
So,
The rate of change of the given table = \(\frac{y}{x}\)
= \(\frac{5}{5}\)
= 7
Hence,
The given table is considered a linear function
c)
The given equation is:
y = 10x + 7
Compare the given equation with
y = mx + c
Where,
m is the rate of change
So,
The rate of change for the given equation is: 10
Hence,
The given equation is considered a linear function
PART A
Is each of the proposals represented by linear functions? Explain.
Answer:
Yes, all the proposals are represented by linear functions
PART B
Does the class have any money in the account now? How can you tell?
Answer:
From the given graph,
We can observe that the straight line does not start from 0 but from 10
So,
The initial value of the graph will be: 10
We know that,
The initial value is considered the y-intercept
Hence, from the above,
We can conclude that the class have the money in the account now i.e., $10
PART C
Which fundraising proposal raises money at the fastest rate? Explain.
Answer:
Since the rate of change is the highest for Paul’s proposal,
Paul’s Proposal raises money at the fastest rate
PART D
If Sarah and her classmates are hoping to raise $200, which proposal do you recommend that Sarah and her classmates choose? Explain why you recommend that proposal.
Answer:
It is given that Sarah and her classmates are hoping to raise $200
So,
To raise the money,
We have to choose the plan which has the highest rate of change
Hence, from the above,
We can conclude that Sarah and her classmates choose Paul’s proposal
3-Act Mathematical Modeling: Every Drop Counts
3-ACT MATH
АСТ 1
Question 1.
After watching the video, what is the first question that comes to mind?
Answer:
After watching the video,
The first question that comes to mind is:
How much amount of water people waste brushing their teeth?
Question 2.
Write the Main Question you will answer.
Answer:
The main question you will answer is:
How much amount of water people waste brushing their teeth?
Question 3.
Construct Arguments Predict an answer to this Main Question. Explain your prediction.
Answer:
The answer to the main question is: 4 gallons
The prediction of the answer for the main question is according to the surveys done by International Organisations
Question 4.
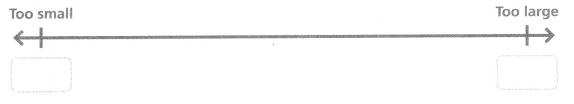
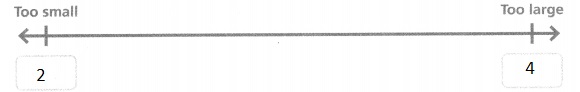
On the number line below, write a number that is too small to be the answer. Write a number that is too large.
Answer:
From the above,
We can observe that
The maximum amount (Too large) of water used to brush teeth is: 4 gallons
The minimum amount (Too small) of water used to brush the teeth is: 2 gallons
Hence,
The representation of the amounts of water used to brush teeth in this situation is:
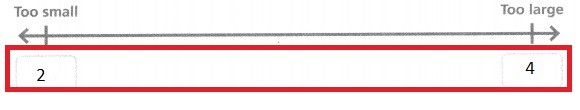
Question 5.
Plot your prediction on the same number line.
Answer:
From the above,
We can observe that there are minimum and maximum amounts of water used to brush the teeth
Now,
Let x be the amount of water used to brush the teeth
So,
The prediction will be: 2 < x < 4
Hence,
The representation of the prediction on the number line is:
ACT 2
Question 6.
What information in this situation would be helpful to know? How would you use that information?
Answer:
The information in this situation that would be helpful to know is:
How much time did it take to completely brush your teeth?
From the above information,
We can estimate the amount of water used to brush your teeth
Question 7.
Use Appropriate Tools What tools can you use to solve the problem? Explain how you would use them strategically.
Answer:
Question 8.
Model with Math
Represent the situation using mathematics.
Use your representation to answer the Main Question.
Answer:
Question 9.
What is your answer to the Main Question? Is it higher or lower than your prediction? Explain why.
Answer:
ACT 3
Question 10.
Write the answer you saw in the video.
Answer:
Question 11.
Reasoning Does your answer match the answer in the video? If not, what are some reasons that would explain the difference?
Answer:
Question 12.
Make Sense and Persevere Would you change your model now that you know the answer? Explain.
Answer:
ACT 3
Reflect
Question 13.
Model with Math
Explain how you used a mathematical model to represent the situation. How did the model help you answer the Main Question?

Answer:
Question 14.
Be Precise How do the units you chose and the method you used help you communicate your answer?
Answer;
SEQUEL
Question 15.
Use Structure How much water will he save in a year?
Answer:
Lesson 3.4 Construct Functions to Model Linear Relationships
ACTIVITY
Explore It!
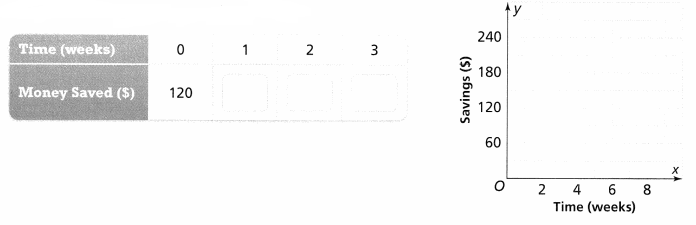
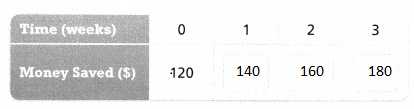
Erick wants to buy a new mountain bike that costs $250. He has already saved $120 and plans to save $20 each week from the money he earns for mowing lawns. He thinks he will have saved enough money after seven weeks.
Answer:
It is given that
Erick wants to buy a new mountain bike that costs $250. He has already saved $120 and plans to save $20 each week from the money he earns for mowing lawns. He thinks he will have saved enough money after seven weeks.
So,
The total amount he saved = The amount he saved already + The amount he planned to save each week
Let,
The number of weeks —-> x
The total amount he saved —-> y
So,
y = $20x + $120
Compare the above equation with y = mx + c
Where,
m s the rate of change (or) slope
c is the y-intercept
So,
For the given equation,
The rate of change (m) is: 20
The y-intercept is: 120
A. Complete the table. Then graph the data.
Answer:
The equation is:
y = $20x + $120
So,
The completed table for the above equation is:
So,
The representation of the given equation in the coordinate plane is:
B. How can you tell that the relationship is a linear function from the table? How can you tell from the graph?
Answer:
We know that,
A relation is said to be a function when an input value matches only with an output value
A function is said to be a linear function when the graph of that function is a straight line
So,
From part (a),
From the table,
We can observe that for each value of the week, there is a different amount saved
So,
From the table,
The given relation is said to be a function
From the graph of the equation,
We can observe that the graph is a straight line
So,
We can say that the function is a linear function
Focus on math practices
Generalize How can the different representations help you determine the properties of functions?
Answer:
The different representations of the functions are:
A) Symbolic or Algebraic representation – The properties can be found out by comparing with the standard form
B) Numerical (Tables) representation – The properties can be found out by the rate of change and the initial values
C) Graphical representation – The properties can be found out by the values of x and y
D) Verbal representation – The properties can be found out by the keywords
? Essential Question
How can you use a function to represent a linear relationship?
Answer:
Another approach to representing linear functions is by using function notation. One example of function notation is an equation written in the form known as the slope-intercept form of a line, where x is the input value, m is the rate of change, and c is the initial value of the dependent variable.
Try It!
How will the height of the ramp change if the plan shows that for every 3 inches of height, the triangle should have a base that is 15 inches long?
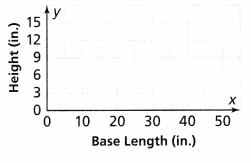
Graph the function. The slope of the function shown in the graph is ![]() . The equation of the function is y =
. The equation of the function is y = ![]()
x. If the base length is 110 inches, then the height of the ramp will be ![]() inches.
inches.
Answer:
It is given that
The plan shows that for every 3 inches of height, the triangle should have a base that is 15 inches long
So,
The rate of change (m) = \(\frac{Rise}{Run}\)
m = \(\frac{3}{15}\)
m = \(\frac{1}{5}\)
So,
The slope of the function shown in the graph is: \(\frac{1}{5}\)
Now,
We know that,
The representation of the linear equation is:
y = mx
So,
y = \(\frac{1}{5}\)x
Where,
y is the height of the ramp
x is the base length of the triangle
Now,
For the base length of 110 inches,
y = \(\frac{1}{5}\) (110)
y = 22 inches
Hence, from the above,
We can conclude that the height of the ramp will be 22 inches for the base length of 110 inches
Convince Me!
Explain why the initial value and the y-intercept are equivalent.
Answer:
An equation in slope-intercept form of a line includes the slope and the initial value of the function. The initial value, or y-intercept, is the output value when the input of a linear function is zero. It is the y-value of the point where the line crosses the y-axis.
Try It!
Jin is tracking how much food he feeds his dogs each week. After 2 weeks, he has used 8\(\frac{1}{2}\) cups of dog food. After 5 weeks, he has used 21\(\frac{1}{4}\) cups. Construct a function in the form y = mx + b to represent the amount of dog food used, y, after x weeks.
Answer:
It is given that
Jin is tracking how much food he feeds his dogs each week. After 2 weeks, he has used 8\(\frac{1}{2}\) cups of dog food. After 5 weeks, he has used 21\(\frac{1}{4}\) cups.
Now,
Let x be the number of weeks
Let y be the number of cups of dog food used
So,
For x = 2, y = 8.5 (The value of 8\(\frac{1}{2}\))
For x = 5, y = 21.25 (The value of 21\(\frac{1}{4}\))
We know that,
The equation in the slope-intercept form is:
y = mx + c
So,
8.5 = 2m + c —–> (1)
21.25 = 5m + c ——> (2)
Solve eq (1) and eq (2)
So,
8.5 = 2m + 21.25 – 5m
8.5 – 21.25 = 2m – 5m
-12.75 = -3m
3m = 12.75
m = \(\frac{12.75}{3}\)
m = 4.25
Now,
For the value of c,
Substitute the value of m either in eq (1) or in eq (2)
So,
8.5 = 2m + c
8.5 = 2 (4.25) + c
8.5 – 8.5 = c
c = 0
Hence, from the above,
We can conclude that the representation of the amount of dog used y, after x weeks in the equation form is:
y = 4.25x
Try It!
The graph shows the relationship between the number of pages printed by a printer and the warm-up time before each printing. What function in the form y = mx + b represents this relationship?
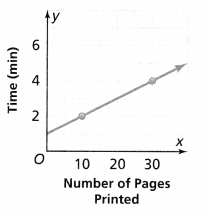
Answer:
It is given that
The graph shows the relationship between the number of pages printed by a printer and the warm-up time before each printing
Now,
The given graph is:
From the given graph,
We can observe that there is an initial value or y-intercept
So,
The y-intercept from the given graph is: 1
Now,
To find the slope from the given graph,
The given points are: (30, 4), and (10, 2)
So,
Slope (m) = \(\frac{2 – 4}{10 – 30}\)
m = \(\frac{-2}{-20}\)
m = \(\frac{1}{10}\)
We know that,
The representation of the equation in the slope-intercept form is:
y = mx + c
So,
y = \(\frac{1}{10}\)x + 1
Hence, from the above,
We can conclude that the equation that represents the given situation is:
y = \(\frac{1}{10}\)x + 1
KEY CONCEPT
A function in the form y= mx + b represents a linear relationship between two quantities, x, and y.
Do You Understand?
Question 1.
?Essential Question How can you use a function to represent a linear relationship?
Answer:
Another approach to representing linear functions is by using function notation. One example of function notation is an equation written in the form known as the slope-intercept form of a line, where x is the input value, m is the rate of change, and c is the initial value of the dependent variable.
Question 2.
Make Sense and Persevere Tonya is looking at a graph that shows a line drawn between two points with a slope of -5. One of the points is smudged and she cannot read it. The points as far as she can tell are (3, 5) and (x, 10). What must the value of x be? Explain.
Answer:
It is given that
Tonya is looking at a graph that shows a line drawn between two points with a slope of -5. One of the points is smudged and she cannot read it. The points as far as she can tell are (3, 5) and (x, 10)
Now,
We know that,
Slope (m) = y2 – y1 / x2 – x1
Compare the given points with (x1, y1), (x2, y2)
So,
–5 = \(\frac{10 – 5}{x – 3}\)
-5 = \(\frac{5}{x – 3}\)
-5 (x – 3) = 5
-5 (x) + 5 (3) = 5
-5x + 15 = 5
-5x = 5 – 15
-5x = -10
5x = 10
x = \(\frac{10}{5}\)
x = 2
Hence, from the above,
We can conclude that the value of x is: 2
Question 3.
Reasoning What is the initial value of all linear functions that show a proportional relationship?
Answer:
We know that,
The representation of the proportional relationship is:
y = mx + 0
Where,
m is the slope (or) rate of change
So,
From the above equation,
We can say that the initial value (or) the y-intercept is: 0
Hence, from the above,
We can conclude that the initial value of all linear functions that show a proportional relationship is: 0
Do You Know How?
Question 4.
Write a function in the form y = mx + b for the line that contains the points (-8.3, -5.2) and (6.4, 9.5).
Answer:
The given points are:
(-8.3, -5.2) and (6.4, 9.5)
Now,
We know that,
Slope (m) = y2 – y1 / x2 – x1
So,
Compare the given points with (x1, y1), (x2, y2)
So,
m = \(\frac{9.5 + 5.2}{6.4 + 8.3}\)
m = \(\frac{14.7}{14.7}\)
m = 1
We know that,
The representation of the equation in the slope-intercept form is:
y = mx + c
So,
y = x + c
Now,
To find the value of c,
Substitute any one of the points in the above equation
So,
-5.2 = -8.3 + c
c = 8.3 – 5.2
c = 3.1
Hence, from the above,
We can conclude that the representation of the linear equation for the given points is:
y = x + 3.1
Question 5.
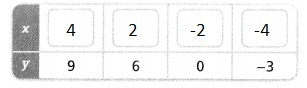
The data in the table below represent a linear relationship. Fill in the missing data.
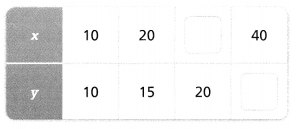
Answer:
It is given that the data in the table represent a linear relationship
So,
For a linear relationship, for each value of x, there is only 1 value of y
Now,
To find the missing data,
Find the rate of change for x and y
For all the values of x,
The rate of change = 20 – 10
= 10
For all the values of y,
The rate of change = 15 – 10
= 5
Hence,
The completed table with the missing data is:
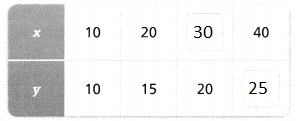
Question 6.
What is an equation that represents the linear function described by the data in Item 5?
Answer:
From the data in Item 5,
Slope (m) = \(\frac{The rate of change of y}{The rate of change of x}\)
m = \(\frac{5}{10}\)
m = \(\frac{1}{2}\)
We know that,
The equation that represents a linear relationship is:
y = mx
So,
y = \(\frac{1}{2}\)x
Hence, from the above,
The equation that represents the linear function described by the data in Item 5 is:
y = \(\frac{1}{2}\)x
Practice & Problem Solving
Question 7.
A line passes through the points (4, 19) and (9, 24). Write a linear function in the form y = mx + b for this line.
Answer:
The given points are:
(4, 19) and (9, 24)
Now,
We know that,
Slope (m) = y2 – y1 / x2 – x1
So,
Compare the given points with (x1, y1), (x2, y2)
So,
m = \(\frac{24 – 19}{9 – 4}\)
m = \(\frac{5}{5}\)
m = 1
We know that,
The representation of the equation in the slope-intercept form is:
y = mx + c
So,
y = x + c
Now,
To find the value of c,
Substitute any one of the points in the above equation
So,
19 = 4 + c
c = 19 – 4
c = 15
Hence, from the above,
We can conclude that the representation of the linear equation for the given points is:
y = x + 15
Question 8.
What is a linear function in the form y = mx + b for the line passing through (4.5, -4.25) with y-intercept 2.5?
Answer:
It is given that
A line passing through (4.5, -4.25) with y-intercept 2.5
We know that,
The y-intercept is the value of y when x = 0
Now,
The given points are:
(4.5, -4.25) and (0, 2.5)
Now,
We know that,
Slope (m) = y2 – y1 / x2 – x1
So,
Compare the given points with (x1, y1), (x2, y2)
So,
m = \(\frac{2.5 + 4.25}{0 – 4.5}\)
m = \(\frac{6.75}{-4.5}\)
m = -1.5
We know that,
The representation of the equation in the slope-intercept form is:
y = mx + c
So,
y = -1.5x + 2.5
Hence, from the above,
We can conclude that the representation of the linear equation for the given points is:
y = -1.5x + 2.5
Question 9.
A car moving at a constant speed passes a timing device at t = 0. After 8 seconds, the car has traveled 840 feet. What linear function in the form y = mx + b represents the distance in feet, d, the car has traveled any number of seconds, t, after passing the timing device?
Answer:
It is given that
A car moving at a constant speed passes a timing device at t = 0. After 8 seconds, the car has traveled 840 feet
We know that,
Speed = \(\frac{Distance}{Time}\)
So,
For a constant speed,
Time is considered as input and distance is considered as the output
It is also given that time will start from (0, 0) i..e, at t = 0
So,
The representation of the equation that passes through the origin is:
y = mx
Where,
m is the rate of change (or) slope
In this situation,
The rate of change = \(\frac{Distance}{Time}\)
So,
y = \(\frac{840}{8}\)x
y = 105x
Hence, from the above,
We can conclude that the linear equation that represents the distance traveled by a car after passing the timing device is:
y = 105x
Question 10.
At time t = 0, water begins to drip out of a pipe into an empty bucket. After 56 minutes, 8 inches of water are in the bucket. What linear function in the form y = mx + b represents the amount of water in inches, w, in the bucket after t minutes?
Answer:
It is given that
At time t = 0, water begins to drip out of a pipe into an empty bucket
Now,
In this situation,
Time is considered as output and the amount of water in the bucket is considered as the input
It is also given that time will start from (0, 0) i..e, at t = 0
So,
The representation of the equation that passes through the origin is:
y = mx
Where,
m is the rate of change (or) slope
In this situation,
The rate of change = \(\frac{Time}{The amount of water}\)
So,
y = \(\frac{56}{8}\)x
y = 7x
Hence, from the above,
We can conclude that the linear equation that represents the amount of water in inches, w, in the bucket after t minutes
y = 7x
Question 11.
The graph of the line represents the cost of renting a kayak. Write a linear function in the form y = mx + b to represent the relationship of the total cost, c, of renting a kayak for t hours.
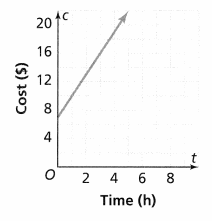
Answer:
It is given that
The graph of the line represents the cost of renting a kayak
Now,
The given graph is:
From the given graph,
We can observe that the line does not pass through the origin and it has the initial value i..e, the y-intercept
So,
From the graph,
The y-intercept is: 8
Now,
To find the slope,
The points from the graph are: (2, 12), and (4, 16)
We know that,
Slope (m) = y2 – y1 / x2 – x1
So,
Compare the given points with (x1, y1), (x2, y2)
So,
m = \(\frac{16 – 12}{4 – 2}\)
m = \(\frac{4}{2}\)
m = 2
We know that,
The representation of the equation in the slope-intercept form is:
y = mx + c
So,
y = 2x + 8
Hence, from the above,
We can conclude that the relationship to represent the total cost, c, of renting a kayak for t hours is:
y = 2x + 8
Question 12.
An online clothing company sells custom sweatshirts. The company charges $6.50 for each sweatshirt and a flat fee of $3.99 for shipping.
a. Write a linear function in the form y = mx + b that represents the total cost, y, in dollars, for a single order of x sweatshirts.
Answer:
It is given that
An online clothing company sells custom sweatshirts. The company charges $6.50 for each sweatshirt and a flat fee of $3.99 for shipping.
So,
The total cost of the sweatshirts = The cost of each sweatshirt + The flat fee of the sweatshirt for shipping
Let the number of sweatshirts be x
let the total cost of the sweatshirts be y
So,
y = $3.99 + $6.50x
Now,
We know that,
The linear equation representation in the slope-intercept form is:
y = mx + c
Hence, from the above,
We can conclude that the equation that represents the total cost, y, in dollars, for a single order of x sweatshirts is:
y = $3.99 + 6.50x
b. Describe how the linear function would change if the shipping charge applied to each sweatshirt.
Answer:
From part (a),
We know that,
The equation that represents the total cost, y, in dollars, for a single order of x sweatshirts, is:
y = $3.99 + $6.50x
Where,
$3.99 is the shipping charge for x sweatshirts,
Now,
If the shipping charge applied to each sweatshirt, then
The representation of the linear equation which we obtained in part (a) is:
y = $6.50x + \(\frac{$3.99}{x}\)
Hence, from the above,
We can conclude that the linear function that represents if the shipping charge applied to each sweatshirt is:
y = $6.50x + \(\frac{$3.99}{x}\)
Question 13.
A store sells packages of comic books with a poster.
a. Model with Math Write a linear function in the form y = mx + b that represents the cost, y, of a package containing any number of comic books, x.
b. Construct Arguments Suppose another store sells a similar package, modeled by a linear function with initial value $7.99. Which store has the better deal? Explain.
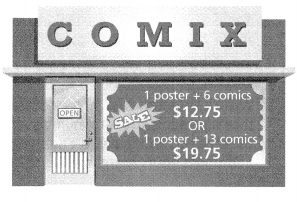
Answer:
a)
It is given that a store seller sells packages of comic books with a poster
Now,
Let x be the number of comics
Let y be the amount obtained by selling comics & poster
So,
For x = 6, y = $12.75
For x = 13, y = $19.75
We know that,
The representation of the linear equation in the slope-intercept form is:
y = mx + c
Where,
m is the slope
c is the y-intercept
Now,
To find the slope,
The points are: (6, 12.75), and (13, 19.75)
Now,
We know that,
Slope (m) = y2 – y1 / x2 – x1
So,
Compare the given points with (x1, y1), (x2, y2)
So,
m = \(\frac{19.75 – 12.75}{13 – 6}\)
m = \(\frac{7}{7}\)
m = 1
So,
y = x + c
Now,
To find the value of c,
Substitute any one of the points in the above equation
So,
12.75 = 6 + c
c = 12.75 – 6
c = 6.75
Hence, from the above,
We can conclude that the representation of the linear equation that represents the cost, y, of a package containing any number of comic books, x is:
y = x + 6.75
b)
It is given that another store sells a similar package, modeled by a linear function with an initial value of $7.99
Now,
From part (a),
The initial value is: $6.75
From the above initial values,
We can observe that
$6.75 < $7.99
Hence, from the above,
We can conclude that another store has the better deal
Question 14.
Higher-Order Thinking Recommendations for safely thawing a frozen turkey are provided on the packaging.
a. What is the thaw rate of the turkey in hours per pound for refrigerator thawing? For cold water thawing?
b. Write a linear function in the form y = mx + b to represent the time, t, in hours it takes to thaw a turkey in the refrigerator as a function of the weight, w, in pounds of the turkey.
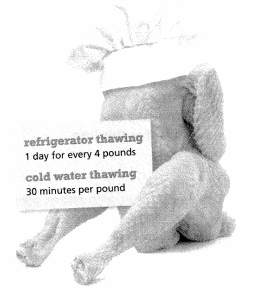
Answer:
a)
We know that,
The thaw rate is nothing but the rate of change
So,
For refrigerator thawing,
Rate of change = \(\frac{The number of pounds}{Time}\)
= 4 pounds per day
We know that
1 day = 24 hours
So,
Rate of change = \(\frac{4}{24}\)
= \(\frac{1}{6}\) pound per hour
For Cold water thawing,
Rate of change = \(\frac{The number of pounds}{Time}\)
= 1 pound per 30 minutes
We know that
1 hour = 60minutes
So,
Rate of change = \(\frac{1 (2)}{1}\)
= 2 pounds per hour
Hence, from the above,
We can conclude that
The rate of change for refrigerator thawing is: \(\frac{1}{6}\) pounds per hour
The rate of change for cold water thawing is: 2 pounds per hour
b)
We know that,
The representation of the linear equation in the slope-intercept form is:
y = mx + c
So,
For refrigerator thawing,
The representation of the linear equation as a function of weight w in pounds is:
y = \(\frac{1}{6}\)x + c
For the value of c,
Substitute (24, 4) in the above equation [ The time as x in hours and the weight as y]
So,
4 = \(\frac{24}{6}\) + c
4 = 4 + c
c = 0
Hence, from the above,
We can conclude that the representation of the linear equation as a function of weight w in pounds is:
y = \(\frac{1}{6}\)x
Question 15.
Reasoning The graph shows the relationship between the number of cubic yards of mulch ordered and the total cost of the mulch delivered.
a. What is the constant rate of change? What does it represent?
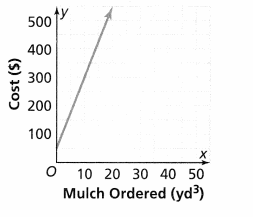
Answer:
It is given that
The graph shows the relationship between the number of cubic yards of mulch ordered and the total cost of the mulch delivered.
Now,
The given graph is:
From the given graph,
To find the rate of change,
The points are: (20, 450), and (10, 300)
Now,
We know that,
Slope (m) = y2 – y1 / x2 – x1
So,
Compare the given points with (x1, y1), (x2, y2)
So,
m = \(\frac{300 – 450}{10 – 20}\)
m = \(\frac{150}{10}\)
m = 15
Hence, from the above,
We can conclude that the constant rate of change for the given graph is: 15
b. What is the initial value? What might that represent?
Answer:
We know that,
The initial value is nothing but the y-intercept
Hence, from the above,
We can conclude that the initial value is 50 and this value represents the initial cost of the mulch
Assessment Practice
Question 16.
An international food festival charges for admission and for each sample of food. Admission and 3 samples cost $5.75. Admission and 6 samples cost $8.75. Which linear function represents the cost, y, for any number of samples, x?
A. y = x + 2.75
B. y = 3x + 2.75
C. y = x + 3
D. y = 3x + 3
Answer:
It is given that
An international food festival charges for admission and for each sample of food. Admission and 3 samples cost $5.75. Admission and 6 samples cost $8.75
Now,
Let x be the number of samples
Let y be the cost of samples &Admission
So,
For x = 3, y = $5.75
For x = 6, y = $8.75
We know that,
The representation of the linear equation in the slope-intercept form is:
y = mx + c
Where,
m is the slope
c is the y-intercept
Now,
To find the slope,
The points are: (3, 5.75), and (6, 8.75)
Now,
We know that,
Slope (m) = y2 – y1 / x2 – x1
So,
Compare the given points with (x1, y1), (x2, y2)
So,
m = \(\frac{8.75 – 5.75}{6 – 3}\)
m = \(\frac{3}{3}\)
m = 1
So,
y = x + c
Now,
To find the value of c,
Substitute any one of the points in the above equation
So,
5.75 = 3 + c
c = 5.75 – 3
c = 2.75
So,
y = x + 2.75
Hence, from the above,
We can conclude that option A matches the given situation
Question 17.
Some eighth-graders are making muffins for a fundraiser. They have already made 200 muffins and figure they can make 40 muffins in an hour.
PART A
Write a linear function in the form y = mx + b that represents the total number of muffins the students will make, y, and the number of additional hours spent making the muffins, x.
Answer:
It is given that
Some eighth-graders are making muffins for a fundraiser. They have already made 200 muffins and figure they can make 40 muffins in an hour.
Now,
Let x be the number of hours
So,
The total number of muffins students will make = The number of muffins that the students had already made + The number of muffins the students will make in x hours if they made 40 muffins in an hour
y = 40x + 200
We know that,
The representation of the linear equation in the slope-intercept form is:
y = mx + c
Hence, from the above,
We can conclude that
A linear function that represents the total number of muffins the students will make, y, and the number of additional hours spent making the muffins, x is:
y = 40x + 200
PART B
How many additional hours would the students spend to make 640 muffins?
Answer:
From part (a),
A linear function that represents the total number of muffins the students will make, y, and the number of additional hours spent making the muffins, x is:
y = 40x + 200
It is given that the number of muffins students made is: 640
So,
y = 640
So,
640 = 40x + 200
40x = 640 – 200
40x = 440
4x = 44
x = \(\frac{44}{4}\)
x = 11 hours
Hence, from the above,
We can conclude that the additional hours the students would spend to make 640 muffins is: 11 hours
Lesson 3.5 Intervals of Increase and Decrease
Solve & Discuss It!
Martin will ride his bike from his house to his aunt’s house. He has two different routes he can take. One route goes up and down a hill. The other route avoids the hill by going around the edge of the hill. How do you think the routes will differ? What do you think about the relationship between speed and time?
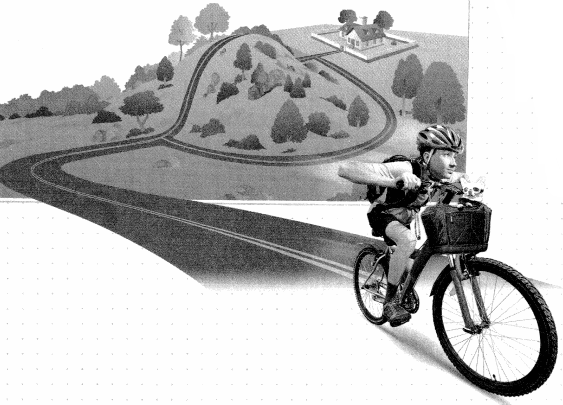
Answer:
It is given that
Martin will ride his bike from his house to his aunt’s house. He has two different routes he can take. One route goes up and down a hill. The other route avoids the hill by going around the edge of the hill.
We know that,
Speed = \(\frac{Distance}{Time}\)
In this situation,
The distance is constant for the 2 routes
So,
As speed increases, the time decreases
Now,
For route 1:
Route 1 is divided into 2 parts
For the first part (Going up),
As there is friction,
The speed decreases as time increases
For the second part (Going down),
The speed increases as time decreases
For route 2:
Route 2 is divided into 2 parts
For the first part (Going down),
The speed increases as time decreases
For the second part,
The speed is constant as time increases
Focus on math practices
Reasoning How do the characteristics of each route affect Martin’s travel time and speed?
Answer:
We know that,
For the constant distance,
Speed ∝ \(\frac{1}{Time}\)
Now,
Route 1 is in the shape of a parabola
In route 1,
For the first part,
The speed increases as time decreases
For the second part,
The speed decreases as time increases
Now,
Route 2 is increasing for some time and later becomes constant
In route 2,
For the first part,
The speed increases as time decreases
For the second part,
The speed is constant as time increases
? Essential Question
How does a qualitative graph describe the relationship between quantities?
Answer:
The formal term to describe a straight-line graph is linear, whether or not it goes through the origin, and the relationship between the two variables is called a linear relationship. Similarly, the relationship shown by a curved graph is called non-linear.
Try It!
The graph at the right shows another interval in the train’s travel. Which best describes the behavior of the train in the interval shown?
As time ![]() , the speed of the train
, the speed of the train
The function is ![]()
Answer:
It is given that the graph shows another interval in the train’s travel
Now,
The given graph is:
From the given graph,
As speed decreases, the time increases
Hence,
The function of the given graph is decreasing in nature
Convince Me!
How would the graph of the function change if the speed of the train was increasing?
Answer:
We know that,
If speed increases, then the time decreases for a constant distance
So,
For a constant distance,
Speed ∝ \(\frac{1}{Time}\)
Hence,
The graph of the function is decreasing in nature as the speed of the train is increased
Try It!
Write a scenario that the graph above could represent. (Example 3)
Answer:
The scenario that the given graph could represent is:
The traveling of a vehicle on a hill
KEY CONCEPT
You can describe the relationship between two quantities by analyzing the behavior of the function relating the quantities in different intervals on a graph.
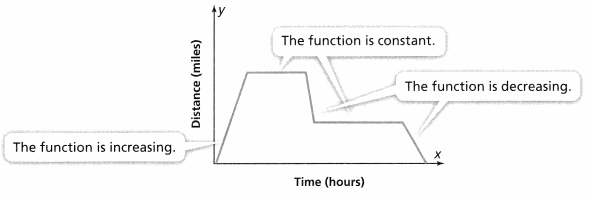
Do You Understand?
Question 1.
Essential Question How does a qualitative graph describe the relationship between quantities?
Answer:
The formal term to describe a straight-line graph is linear, whether or not it goes through the origin, and the relationship between the two variables is called a linear relationship. Similarly, the relationship shown by a curved graph is called non-linear.
Question 2.
Look for Relationships How would knowing the slope of a linear function help determine whether a function is increasing or decreasing?
Answer:
The graph of an increasing function has a positive slope. A line with a positive slope slants upward from left to right. For a decreasing function, the slope is negative. The output values decrease as the input values increase.
Question 3.
Use Structure What kind of graph of a function shows the same output values, or y-values, for each input value, or x-value?
Answer:
The vertical line test can be used to determine whether a graph represents a function. A vertical line includes all points with a particular x value. The y value of a point where a vertical line intersects a graph represents an output for that input x value.
Do You Know How?
Question 4.
What does the graph of the function at each interval represent?
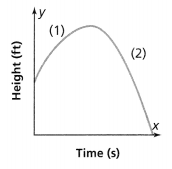
Answer:
The given graph is:
Now,
The given graph is divided into 2 intervals
In the first interval,
The height increases with the increase of time
In the second interval,
The height decreases with the increase of time
Question 5.
In which intervals is the function increasing, decreasing, or constant?
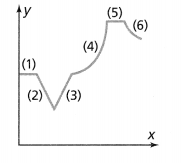
Answer:
The given graph is:
We know that,
The graph is said to be increasing in nature when the line moves from left to right or the slope is positive
The graph is said to be decreasing in nature when the line moves from right to left or the slope is negative
The graph is said to be constant in nature when the line is parallel to any one of the coordinate axes
Hence, from the above,
We can conclude that
The intervals that the function is constant – 1, 5
The intervals that the function is increasing – 3, 4
The intervals that the function is decreasing – 2, 6
Practice & Problem Solving
Question 6.
Use the graph to complete the statements.
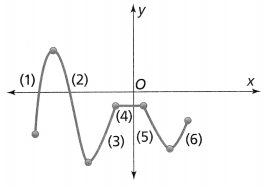
The function is ![]() in intervals 1, 3, and 6.
in intervals 1, 3, and 6.
The function is ![]() in intervals 2 and 5.
in intervals 2 and 5.
The function is constant in interval ![]()
Answer:
The given graph is:
We know that,
The graph is said to be increasing in nature when the line moves from left to right or the slope is positive
The graph is said to be decreasing in nature when the line moves from right to left or the slope is negative
The graph is said to be constant in nature when the line is parallel to any one of the coordinate axes
Hence, from the above,
We can conclude that
The intervals that the function is constant – 4
The intervals that the function is increasing – 1, 3, 6
The intervals that the function is decreasing – 2, 5
Question 7.
The graph below shows the temperature in Paula’s house over time after her mother turned on the air conditioner. Describe the relationship between the two quantities.
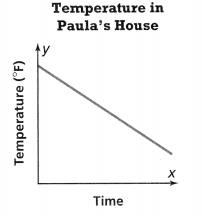
Answer:
It is given that
The graph below shows the temperature in Paula’s house over time after her mother turned on the air conditioner
Now,
The given graph is:
From the given graph,
We can observe that
As time increases, the temperature decreases
Hence, from the above,
We can conclude that
Temperature (°F) ∝ \(\frac{1}{Time}\)
Question 8.
You have a device that monitors the voltage across a lamp over time. The results are shown in the graph. Describe the behavior of the function in each interval.
In interval (a), the function is ![]()
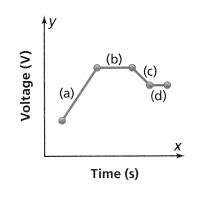
In the interval (b), the function is ![]()
In the interval (c), the function is ![]()
In interval (d), the function is ![]()
Answer:
It is given that
You have a device that monitors the voltage across a lamp over time. The results are shown in the graph
Now,
The given graph is:
We know that,
The graph is said to be increasing in nature when the line moves from left to right or the slope is positive
The graph is said to be decreasing in nature when the line moves from right to left or the slope is negative
The graph is said to be constant in nature when the line is parallel to any one of the coordinate axes
Hence, from the above,
We can conclude that
In interval (a), the function is increasing
In the Interval (b), the function is constant
In the interval (c), the function is decreasing
In the interval (d), the function is constant
Question 9.
The graph below shows the height of a roller coaster over time during a single ride. Circle the intervals in which the function is increasing. In which interval is the increase the greatest?
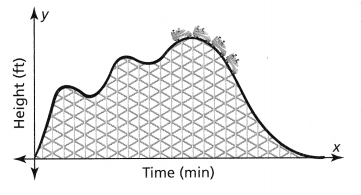
Answer:
It is given that
The graph below shows the height of a roller coaster over time during a single ride.
Now,
The given graph is:
We know that,
The graph is said to be increasing in nature when the line moves from left to right or the slope is positive
The graph is said to be decreasing in nature when the line moves from right to left or the slope is negative
The graph is said to be constant in nature when the line is parallel to any one of the coordinate axes
Now,
The given graph with the intervals is:
So,
From the given graph,
The intervals which are increasing in nature are: 1, 3, 5
Hence, from the above,
We can conclude that the increase is the greatest in the 1st interval
Question 10.
Reasoning The graph shows the speed of a car over time. What might the constant intervals in the function represent?
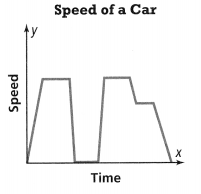
Answer:
It is given that
The graph shows the speed of a car over time
Now,
The given graph is:
We know that,
The graph is said to be increasing in nature when the line moves from left to right or the slope is positive
The graph is said to be decreasing in nature when the line moves from right to left or the slope is negative
The graph is said to be constant in nature when the line is parallel to any one of the coordinate axes
We know that,
Speed = \(\frac{Distance}{Time}\)
Now,
From the given graph,
We can observe that
The constant lines represent that the speed becomes constant even though the time is increasing
Hence, from the above,
We can conclude that the constant lines in the given graph represent the constant speed
Question 11.
Higher-Order Thinking A signal generator is used to generate signals for a lab experiment over time. The graph shows the frequency of the signal generated.
a. In how many intervals is the function decreasing?
b. How are the decreasing intervals alike?
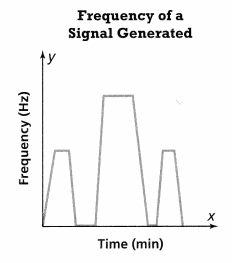
Answer:
It is given that
A signal generator is used to generate signals for a lab experiment over time. The graph shows the frequency of the signal generated.
Now,
The given graph is:
We know that,
The graph is said to be increasing in nature when the line moves from left to right or the slope is positive
The graph is said to be decreasing in nature when the line moves from right to left or the slope is negative
The graph is said to be constant in nature when the line is parallel to any one of the coordinate axes
Now,
The given graph with the marked intervals are:
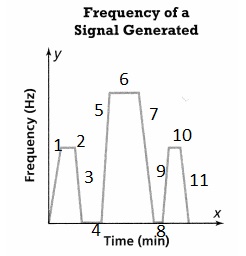
a)
The intervals that the function is decreasing are: 3, 7, 11
b)
The decreasing intervals are all decreasing in nature and have a negative slope
c. How are the decreasing intervals different?
Answer:
The sizes of the decreasing intervals are different
So,
The values of the negative slopes for decreasing intervals will also be different
Question 12.
Critique Reasoning The graph shows the speed of a person riding his stationary exercise bicycle over time. a. A student claims that the function is constant in two intervals. Do you agree? Explain.
Answer:
It is given that
The graph shows the speed of a person riding his stationary exercise bicycle over time. a. A student claims that the function is constant in two intervals.
We know that,
The graph is said to be increasing in nature when the line moves from left to right or the slope is positive
The graph is said to be decreasing in nature when the line moves from right to left or the slope is negative
The graph is said to be constant in nature when the line is parallel to any one of the coordinate axes
So,
From the given graph,
We can observe that
The number of intervals that are constant in nature is: 4
Hence, from the above,
We can conclude that the claim of the student is not correct
b. What error might the student have made?
Answer:
The student considered only the highest constant intervals but not the lowest intervals
The student also did not consider the last constant interval due to the misconception that it is decreasing in nature but it is constant after that decreasing in nature
So,
The above are the errors the student has made
Question 13.
Look for Relationships The graph shows the speed of a roller coaster over time. Describe the relationship of speed as a function of time.
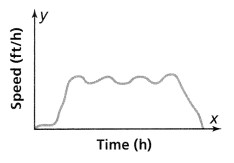
Answer:
It is given that
The graph shows the speed of a roller coaster over time. Describe the relationship of speed as a function of time.
Now,
The given graph is:
From the given graph,
We can observe that
First, the speed of a roller coaster increases with time, and then it fluctuates between increasing and decreasing as time increases further, and at last, the speed of the roller coaster decreases
Assessment Practice
Question 14.
Which statements about the graph are true? Select all that apply.
![]() The graph is decreasing in intervals (1) and (4).
The graph is decreasing in intervals (1) and (4).
![]() The graph shows a constant function in interval (2).
The graph shows a constant function in interval (2).
![]() The graph is increasing in intervals (2) and (4).
The graph is increasing in intervals (2) and (4).
![]() The graph has a constant rate of change.
The graph has a constant rate of change.
![]() The graph shows a constant function in interval (3).
The graph shows a constant function in interval (3).
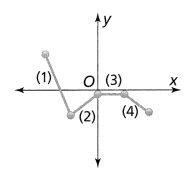
Answer:
Let the given options be named as A, B, C, D, and E respectively
Now,
The given graph is:
We know that,
The graph is said to be increasing in nature when the line moves from left to right or the slope is positive
The graph is said to be decreasing in nature when the line moves from right to left or the slope is negative
The graph is said to be constant in nature when the line is parallel to any one of the coordinate axes
Hence, from the above,
We can conclude that the options that match with the given situation are: A and E
Lesson 3.6 Sketch Functions from Verbal Descriptions
ACTIVITY
Explain It!
The Environmental Club is learning about oil consumption and energy conservation around the world. Jack says oil consumption in the United States has dropped a lot. Ashley says oil consumption in China is the biggest problem facing the world environment.
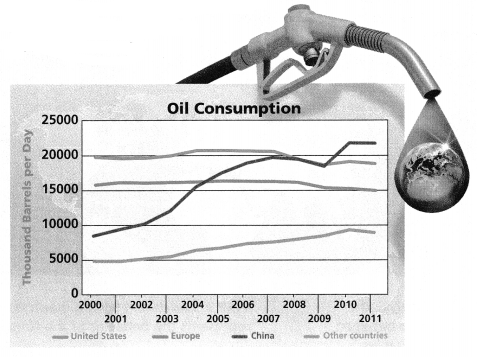
A. Do you agree or disagree with Jack’s statement? Construct an argument based on the graph to support your position.
Answer:
The given graph is:
Now,
The statement of Jack is:
Oil consumption in the United States has dropped a lot
Now,
From the given graph,
We can observe that the oil consumption of the United States (The first line in the graph) is constant from 2000 to 2003 and the consumption is constant from 2004 to 2008 and the consumption decreased abruptly from 2008 to 2011
Hence, from the above,
We can conclude that we can agree with Jack’s statement
B. Do you agree or disagree with Ashley’s statement? Construct an argument based on the graph to support your position.
Answer:
The given graph is:
Now,
The statement of Ashley is:
Oil consumption in China is the biggest problem facing the world environment.
Now,
From the given graph,
We can observe that the oil consumption of China (The third line in the graph) is constant from 2000 to 2004 and the consumption is increased abruptly from 2004 to 2008 and the consumption increased minimally from 2008 to 2011
Hence, from the above,
We can conclude that we can agree with Ashley’s statement since China’s consumption of oil will make the other countries suffer
Focus on math practices
Look for Relationships What trend do you see in oil consumption in the United States and in Europe?
Answer:
The given graph is:
From the given graph,
We can observe that
The trend in the oil consumption of the United States and Europe (The first line and the second line in the graph) is:
a) The consumption increases gradually for both the United States and Europe from 2000 to 2003
b) From 2004 to 2008, the oil consumption of the United States becomes constant but the consumption of Europe increases gradually
c) From 2009 to 2011, the oil consumption of the United States and Europe decreases gradually
? Essential Question
How does the sketch of a graph of a function help describe its behavior?
Answer:
From the graph,
We can observe that,
At t = 0,
The level of oxygen is full
At t = 22 minutes,,
The level of oxygen decreases
Hence, from the above,
We can conclude that
The behavior of the time and the oxygen level is:
Time ∝ \(\frac{1}{Oxygen level}\)
Try It!
The weight of the water exerts pressure on a diver. At a depth of 10 feet, the water pressure is 19.1 pounds per square inch (psi) and at a depth of 14 feet, the water pressure is 20.9 psi. Complete the statements, and then sketch the qualitative graph of this function.
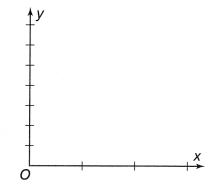
The input, or x-variable, is ![]()
The output, or y-variable, is ![]()
Answer:
It is given that
The weight of the water exerts pressure on a diver. At a depth of 10 feet, the water pressure is 19.1 pounds per square inch (psi) and at a depth of 14 feet, the water pressure is 20.9 psi.
So,
From the above statements,
We can observe that
As the depth of the water increases, the water pressure also increases
So,
The input or x-variable for the given situation is: Depth
The output or y-variable for the given situation is: Water pressure
Now,
To draw the graph,
The required points are: (10, 19.1), and (14, 20.9)
We know that,
the equation of the straight line in the slope-intercept form is:
y = mx + c
Now,
We know that,
Slope (m) = y2 – y1 / x2 – x1
So,
Compare the given points with (x1, y1), (x2, y2)
So,
m = \(\frac{20.9 – 19.1}{14 – 10}\)
m = \(\frac{1.8}{4}\)
m = \(\frac{9}{20}\)
So,
y = \(\frac{9}{20}\)x + c
Now,
To find the value of c,
Substitute any one of the points in the above equation
So,
19.1 = \(\frac{9}{20}\) (10) + c
c = 19.1 – 4.5
c = 14.6
So,
y = \(\frac{9}{20}\)x + 14.6
Hence,
The representation of the above equation in the coordinate plane is:
Convince Me!
Generalize How are the sketches of the two functions similar? How are they different?
Answer:
From Example 1 and the above item’s graph,
We can observe that both graphs have the equation in the slope-intercept form
But,
The graph in Example 1 is decreasing in nature
The graph in the above item is increasing in nature
Try It!
Haru rides his bike from his home for 30 minutes at a fast pace. He stops to rest for 20 minutes and then continues in the same direction at a slower pace for 30 more minutes. Sketch a graph of the relationship of Haru’s distance from home over time.
Answer:
It is given that
Haru rides his bike from his home for 30 minutes at a fast pace. He stops to rest for 20 minutes and then continues in the same direction at a slower pace for 30 more minutes.
Hence,
The graph of the relationship of Haru’s distance from the house over time is:
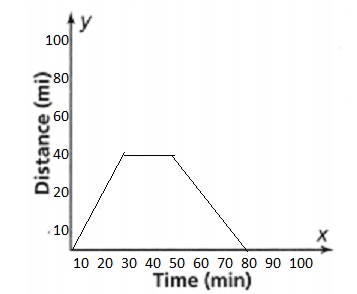
KEY CONCEPT
You can sketch a graph of a function to describe its behavior. When sketching a function, follow these steps:
1. Identify the two variables (input, output) that have a relationship.
2. Analyze the situation. Look for keywords that indicate that the function is increasing, decreasing, or constant.
3. Sketch the graph.
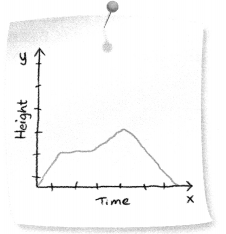
Do You Understand?
Question 1.
? Essential Question How does the sketch of a graph of a function help describe its behavior?
Answer:
From the graph,
We can observe that,
At t = 0,
The level of oxygen is full
At t = 22 minutes,,
The level of oxygen decreases
Hence, from the above,
We can conclude that
The behavior of the time and the oxygen level is:
Time ∝ \(\frac{1}{Oxygen level}\)
Question 2.
Make Sense and Persevere How do you know which variable goes with which axis when you graph?
Answer:
The independent variable belongs on the x-axis (horizontal line) of the graph and the dependent variable belongs on the y-axis (vertical line).
Question 3.
Reasoning How can you determine the shape of a graph?
Answer:
The four ways to describe shape are whether it is symmetric, how many peaks it has if it is skewed to the left or right, and whether it is uniform. A graph with a single peak is called unimodal. A single peak over the center is called bell-shaped. And, a graph with two peaks is called bimodal.
Do You Know How?
Question 4.
A class plants a tree. Sketch the graph of the height of the tree over time.
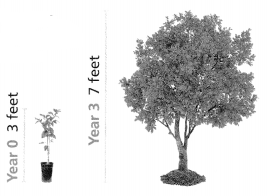
a. Identify the two variables.
Answer:
It is given that a class plants a tree
Now,
From the given figure,
We can observe that
As time increases, the height of the tree increases
Hence, from the above,
We can conclude that
Input variable (or) x-coordinate: Time
Output variable (or) y-coordinate: Height of the tree
b. How can you describe the relationship between the two variables?
Answer:
From part (a),
We can observe that
As time increases, the height of the tree increases
Hence, from the above,
We can conclude that the relationship between the variables is:
Time ∝ Height of the tree
c. Sketch the graph.
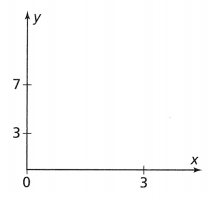
Answer:
To draw the graph,
The required points are: (0, 3), and (3, 7)
We know that,
the equation of the straight line in the slope-intercept form is:
y = mx + c
Now,
We know that,
Slope (m) = y2 – y1 / x2 – x1
So,
Compare the given points with (x1, y1), (x2, y2)
So,
m = \(\frac{7 – 3}{3 – 0}\)
m = \(\frac{4}{3}\)
So,
y = \(\frac{4}{3}\)x + c
Now,
To find the value of c,
Substitute any one of the points in the above equation
So,
3 = \(\frac{4}{3}\) (0) + c
c = 3 – 0
c = 3
So,
y = \(\frac{4}{3}\)x + 3
Hence,
The representation of the above equation in the coordinate plane is:
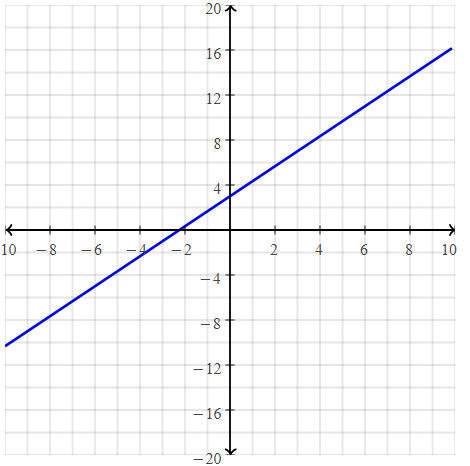
Question 5.
An airplane takes 15 minutes to reach its cruising altitude. The plane cruises at that altitude for 90 minutes, and then descend for 20 minutes before it lands. Sketch the graph of the height of the plane over time.
Answer:
It is given that
An airplane takes 15 minutes to reach its cruising altitude. The plane cruises at that altitude for 90 minutes, and then descend for 20 minutes before it lands.
Hence,
The graph of the height of the plane over time is (Height of the plane is any value) is:
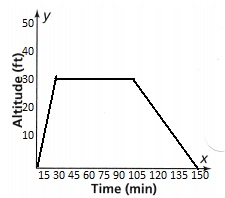
Practice & Problem Solving
Question 6.
What relationship between money (in dollars) and time (in months) does this graph show? Write a description of the given graph.
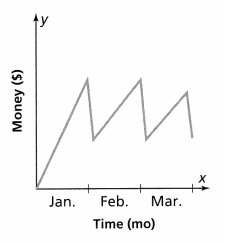
Answer:
The given graph is:
From the given graph,
We can observe that
The amount of money is in an increasing trend for the first half of the month
The amount of money is in a decreasing trend for the second half of the month
Question 7.
When a new laptop became available in a store, the number sold in the first week was high. Sales decreased over the next two weeks and then they remained steady over the next two weeks. The following week, the total number sold by the store increased slightly. Sketch the graph that represents this function over the six weeks.
Answer:
It is given that
When a new laptop became available in a store, the number sold in the first week was high. Sales decreased over the next two weeks and then they remained steady over the next two weeks. The following week, the total number sold by the store increased slightly
Hence,
The graph which represents the given function over the six weeks is:
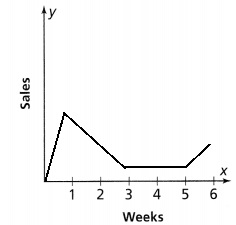
Question 8.
Aaron’s mother drives to the gas station and fills up her tank. Then she drives to the market. Sketch the graph that shows the relationship between the amount of fuel in the gas tank of her car and time.
Answer:
It is given that
Aaron’s mother drives to the gas station and fills up her tank. Then she drives to the market.
So,
At first, the amount of fuel in the gas tank will be of some initial value and it is in an increasing trend after filling up the tank
After that, when she drives to the market, the amount of fuel will be in a decreasing trend over time
Hence,
The graph that shows the relationship between the amount of fuel in the gas tank of her car and time is:
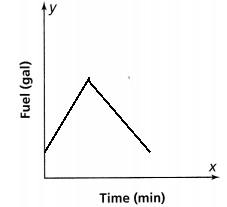
Question 9.
Melody starts at her house and rides her bike for 10 minutes to a friend’s house. She stays at her friend’s house for 60 minutes. Sketch a graph that represents this description.
Answer:
It is given that
Melody starts at her house and rides her bike for 10 minutes to a friend’s house. She stays at her friend’s house for 60 minutes
Hence,
The graph that represents the above description is:
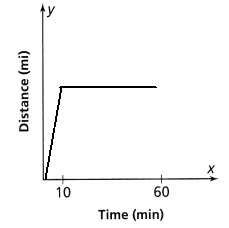
Question 10.
Which description best represents the graph shown?
A. People are waiting for a train. A train comes and some people get on. The other people wait for the next train. As time goes by, people gradually leave the station.
B. One train arrives and some people get off the train and wait in the station.
C. People are waiting for a train. Everyone gets on the first train that comes.
D. People are waiting for a train. A train comes and some people get on the train. The other people wait for the next train. Another train arrives and all of the remaining people get on.
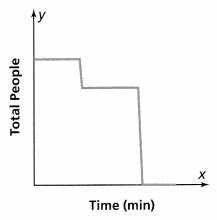
Answer:
The given graph is:
From the given graph,
We can observe that
At first, there are some people and after some time, the number of people decreased
After some time, there are some people other than the people that decreased and after some further time, the total number of people becomes zero
Hence, from the above,
We can conclude that option D matches the above description
Question 11.
A baker has already made 10 cakes. She can make the same number of cakes each hour, which she does for 5 hours. Sketch the graph of the relationship between the number of cakes made and time.
Answer:
It is given that
A baker has already made 10 cakes. She can make the same number of cakes each hour, which she does for 5 hours.
So,
The initial value for the given graph is: 10
Hence,
The graph of the relationship between the number of cakes made and time is:
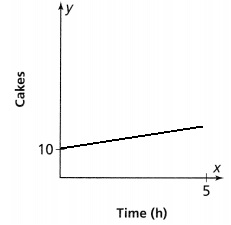
Question 12.
Model with Math An air cannon launches a T-shirt upward toward basketball fans. It reaches a maximum height and then descends for a couple seconds until a fan grabs it. Sketch the graph that represents this situation.
Answer:
It is given that
An air cannon launches a T-shirt upward toward basketball fans. It reaches a maximum height and then descends for a couple of seconds until a fan grabs it
We know that,
The projectile (Graph) of an air cannon is always like a “Parabola”
Hence,
The graph that represents the given situation is:
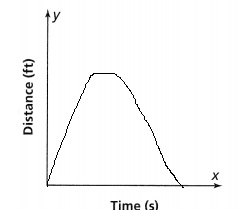
Question 13.
Higher-Order Thinking Write a verbal description of how these two variables are related. The description must suggest at least two intervals. Sketch the graph that represents the verbal description.
Answer:
The verbal description of the relationship between the total people and time in hours is:
People are waiting for a train. A train comes and some people get on the train. The other people wait for the next train. Another train arrives and all of the remaining people get on.
Hence,
The graph that describes the above verbal description is:
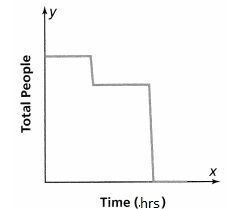
Assessment Practice
Question 14.
A baseball team scores the same number of runs in each of the first 4 innings. After that, the team did not score a run for the rest of the game, which lasts 9 innings. Let x represent the innings of the game, and y represent the total number of runs.
PART A
Sketch the graph of this situation below.
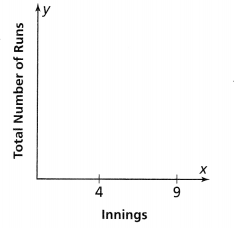
Answer:
It is given that
A baseball team scores the same number of runs in each of the first 4 innings. After that, the team did not score a run for the rest of the game, which lasts 9 innings.
Hence,
The graph for the above situation is:
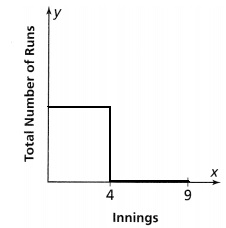
PART B
How would the graph change if the innings in which the team scores runs changes?
Answer:
If the innings in which the team scores runs change, then
The graph will be either in an increasing trend or in a decreasing trend
Topic 3 REVIEW
? Topic Essential Question
How can you use functions to model linear relationships?
Answer:
Another approach to representing linear functions is by using function notation. One example of function notation is an equation written in the form known as the slope-intercept form of a line, where x is the input value, m is the rate of change, and b is the initial value of the dependent variable.
Vocabulary Review
Match each vocabulary term with its definition.
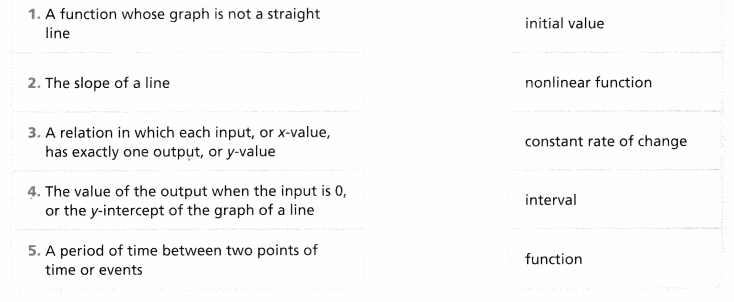
Answer:
Each vocabulary term with its definition is:
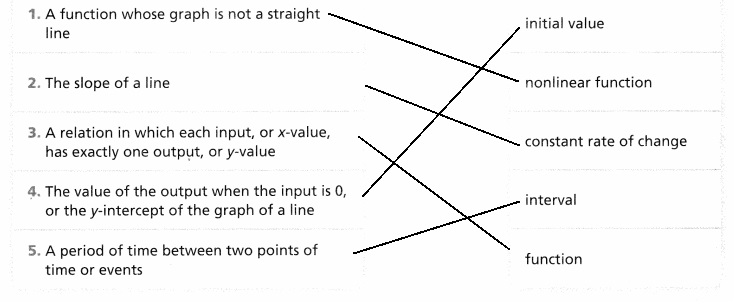
Use Vocabulary in Writing
Explain how to write a linear function in the form y = mx + b by using the two points given below. Use vocabulary words in your explanation. (0, -2), (2, 6)
Answer:
The given points are:
(0, -2) and (2, 6)
Now,
We know that,
Slope (m) = y2 – y1 / x2 – x1
So,
Compare the given points with (x1, y1), (x2, y2)
So,
m = \(\frac{6 + 2}{2 – 0}\)
m = \(\frac{8}{2}\)
m = 4
We know that,
The representation of the equation in the slope-intercept form is:
y = mx + c
So,
y = 4x + c
Now,
To find the value of c,
Substitute any one of the points in the above equation
So,
-2 = 0 + c
c = -2 – 0
c = -2
Hence, from the above,
We can conclude that the representation of the linear equation for the given points is:
y = 4x – 2
Concepts and Skills Review
LESSON 3.1 Understand Relations and Functions
Quick Review
A relation is a set of ordered pairs. A relation is a function if each input, or x-value, has exactly one unique output, or y-value.
Practice
Question 1.
Is the relation shown in the table a function? Explain.
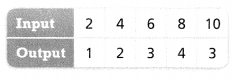
Answer:
The given relation is:
We know that,
A relation is said to be a function if each input has only 1 output
So,
From the given relation,
We can observe that each input has only 1 output
Hence, from the above,
We can conclude that the given relation is a function
Question 2.
Does the relation {(-5, -3), (7, 2), (3,8), (3, -8), (5, 10)} represent a function? Use the arrow diagram. Then explain your answer.
Answer:
The given ordered pairs are:
(-5, -3), (7, 2), (3,8), (3, -8), (5, 10)
We know that,
The ordered pairs are in the form of (input (x), output (y))
In the arrow diagram,
The left side represents the values of the input
The right side represents the values of the output
So,
The representation of the ordered pairs in the arrow diagram is:
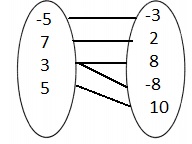
We know that,
A relation is said to be a function only when each input corresponds with only 1 output
Now,
From the arrow diagram,
We can observe that
The same input corresponds with 2 outputs
Hence, from the above,
We can conclude that the given relation is not a function
LESSON 3.2 Connect Representations of Functions
Quick Review
You can represent a function in a table, in a graph, or as an equation. The graph of a linear function is a straight line.
Practice
Mark has a $100 gift card to buy apps for his smartphone. Each week, he buys one new app for $4.99.
1. Write an equation that relates the amount left on the card, y, over time, x.
Answer:
It is given that
Mark has a $100 gift card to buy apps for his smartphone. Each week, he buys one new app for $4.99.
Now,
Let y be the amount left on the card
Let x be the number of weeks
So,
The amount left on the card = The total amount of the card – The amount of money he used to buy a new app for x weeks
y = $100 – $4.99x
Hence, from the above,
We can conclude that
The equation that relates the amount left on the card, y, over time, x is:
y = $100 – $4.99x
2. Make a graph of the function.
Answer:
From part (a),
The equation that relates the amount left on the card, y, over time, x is:
y = $100 – $4.99x
Hence,
The representation of the above equation in the coordinate plane is:
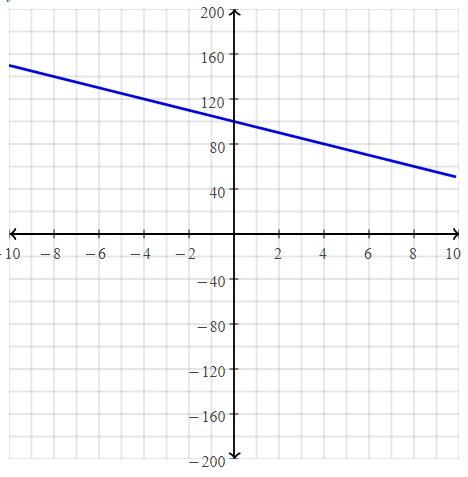
LESSON 3.3 Compare Linear and Nonlinear Functions
Quick Review
You can compare functions in different representations by looking at the properties of functions: the constant rate of change and the initial value.
Practice
Two linear functions are shown.
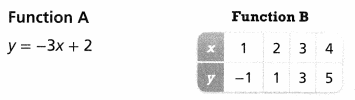
Answer:
The given linear functions are:
Function A:
Compare the given equation with
y = mx + c
Where,
m is the rate of change (or) slope
c is the initial value (or) y-intercept
So,
From the above equation,
The rate of change is: -3
The initial value is: 2
Function B:
From the given table,
We can observe that
The rate of change for all the values of x is: 1
The rate of change for all the values of y is: 2
So,
The rate of change for the table = \(\frac{y}{x}\)
= \(\frac{2}{1}\)
= 2
We know that,
The initial value is the value of y when x = 0
So,
For the given table,
The initial value is: 0
The rate of change is: 2
Question 1.
Which function has the greater initial value? Explain.
Answer:
Function A has the greater initial value
Question 2.
Which function has the greater rate of change?
Answer:
Function B has the greater rate of change
LESSON 3.4 Construct Functions to Model Linear Relationships
Quick Review
A function in the form y = mx + b represents a linear relationship between two quantities, x and y, where m represents the constant rate of change and b represents the initial value.
Practice
Question 1.
What is the equation of a line that passes through (0.5, 4.25) and (2, 18.5) and has a y-intercept of -0.5?
Answer:
It is given that
A line passing through (0.5, 4.25), and (2, 18.5) and has a y-intercept of -0.5
We know that,
The y-intercept is the value of y when x = 0
Now,
The given points are:
(0.5, 4.25) and (2, 18.5)
Now,
We know that,
Slope (m) = y2 – y1 / x2 – x1
So,
Compare the given points with (x1, y1), (x2, y2)
So,
m = \(\frac{18.5 – 4.25}{2 – 0.5}\)
m = \(\frac{14.25}{1.5}\)
m = 9.5
We know that,
The representation of the equation in the slope-intercept form is:
y = mx + c
So,
y = 9.5x – 0.5
Hence, from the above,
We can conclude that the representation of the linear equation for the given points is:
y = 9.5x – 0.5
Question 2.
The graph shows the relationship of the number of gallons being drained from an aquarium over time. What function models the relationship?
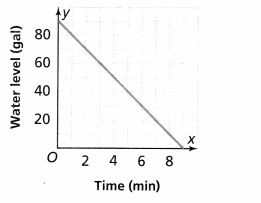
Answer:
It is given that
The graph shows the relationship of the number of gallons being drained from an aquarium over time.
Now,
The given graph is:
From the given graph,
We can observe that there is an initial value or y-intercept
So,
The y-intercept from the given graph is: 90
Now,
To find the slope from the given graph,
The given points are: (0, 90), and (9, 0)
So,
Slope (m) = \(\frac{0 – 90}{9 – 0}\)
m = \(\frac{-90}{9}\)
m = -10
We know that,
The representation of the equation in the slope-intercept form is:
y = mx + c
So,
y = -10x + 90
Hence, from the above,
We can conclude that the equation that represents the given relationship is:
y = -10x + 90
LESSON 3-5 Intervals of Increase and Decrease
Quick Review
You can describe the relationship between two quantities by looking at the behavior of the line at different intervals on a qualitative graph. The function is increasing if both x- and y-values increase. The function is decreasing if the y-values decrease as the x-values increase.
Practice
The graph shows the altitude of an airplane over time.
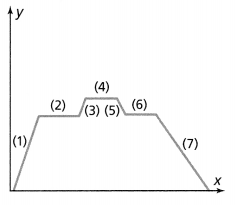
Answer:
We know that,
The graph is said to be increasing in nature when the line moves from left to right or the slope is positive
The graph is said to be decreasing in nature when the line moves from right to left or the slope is negative
The graph is said to be constant in nature when the line is parallel to any one of the coordinate axes
Question 1.
In which intervals is the graph of the function constant? Explain.
Answer:
The intervals in which the graph of the function is constant are: 2, 4, 6
Question 2.
In which intervals is the graph of the function decreasing? Explain.
Answer:
The intervals in which the graph of the function is decreasing in nature are: 5, 7
LESSON 3.6 Sketch Functions from Verbal Descriptions
Quick Review
You can sketch a graph of a function to describe its behavior. When sketching a function, identify the variables (input, output) that have a relationship, analyze the situation, and then sketch the graph.
Practice
Question 1.
Jack’s mother brings him a bowl of carrots as a snack. At first he does not eat any; then he eats one at a time until half of the carrots are gone. Then he does not eat any more. Sketch a graph that shows the number of carrots in the bowl over time.
Answer:
It is given that
Jack’s mother brings him a bowl of carrots as a snack. At first, he does not eat any; then he eats one at a time until half of the carrots are gone. Then he does not eat anymore
So,
At first,
The number of carrots present in a bowl is: An arbitrary number
The number of carrots Jack consumed is: 0
Hence,
The graph that shows the number of carrots in the bowl over time is:
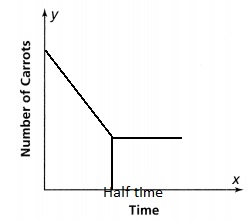
Topic 3 Fluency Practice
What’s the Message?
In each row, determine which equation has the greater solution. Circle the letter next to the equation with the greater solution in each row.
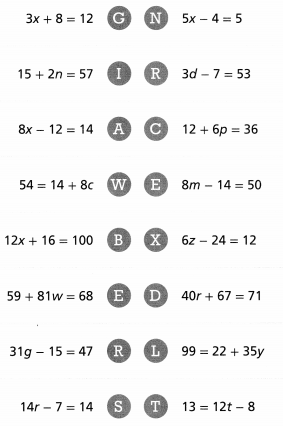
Answer:
The row of equations that has great solutions are:
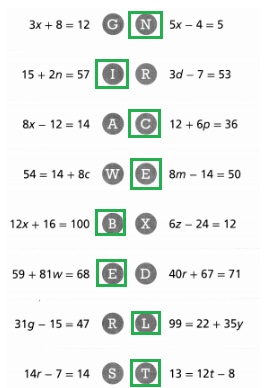
What does the zero say to the eight?

Answer:
The statement said by zero to eight is:
You are greater than me