Go Math Grade 3 Answer Key Chapter 2 Represent and Interpret Data Extra Practice helps you clarify all your concerns easily. Know the Tips and Tricks to Solve the Problems on Go Math Grade 3 Ch 2 from Go Math Grade 3 Answer Key. Cross check your solutions with the Go Math Grade 3 Chapter 2 Answer Key Extra Practice and assess your preparation standard and bridge the knowledge gap accordingly.
Go Math Grade 3 Answer Key Chapter 2 Represent and Interpret Data Extra Practice
You can solve problems in Go Math Grade 3 Chapter 2 Represent and Interpret Data using different approaches. But to help you solve them easily we have listed the step by step solutions for all the exercise questions in HMH Go Math Grade 3 Chapter 2. Learn all of them easily and enhance your subject knowledge on the corresponding topics instantly. Utilize the Go Math Solution Key Chapter 2 Represent and Interpret Data Extra Practice for better understanding.
Common Core – Page No. 45000
Lesson 2.1
Use the Pets tables for 1–2.
Question 1.
Manny collected data about pets owned by students in his class. Complete Manny’s tally table and frequency table.
| Pets | |
| Pets | Tally |
| Cat | ________ |
| Dog | ________ |
| Bird | ________ |
| Fish | ________ |
Answer:
| Pets | |
| Pets | Tally |
| Cat | |||| |
| Dog | || |
| Bird | | |
| Fish | | |
Question 1.
| Pets | |
| Pets | Frequency |
| ______ | 4 |
| ______ | 2 |
| ______ | 1 |
| ______ | 1 |
Answer:
| Pets | |
| Pets | Frequency |
| Cat | 4 |
| Dog | 2 |
| Bird | 1 |
| Fish | 1 |
Question 2.
How many more students have cats than have dogs and birds combined?
______ students
Answer: 1
Explanation:
Number of students who have cats = 4
Number of students who have Dogs = 2
Number of students who have Birds = 1
Total students who have Dogs and birds combined = 2 + 1 = 3
To know how many more students have cats than have dogs and birds combined, we need to subtract students who have Dogs and birds combined from the Number of students who have cats.
4 – 3 = 1
Therefore the answer is 1.
Lessons 2.2–2.3
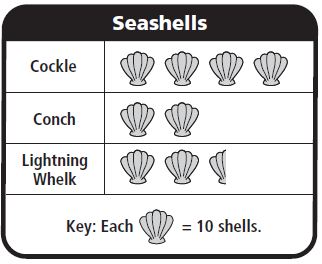
Use the Seashells picture graph for 3–5.

Question 3.
Maggie has a picture graph that shows the seashells she collected. How many seashells did Maggie collect in all?
______ seashells
Answer: 85
Explanation:
Number of Cockle shells =4 ![]()
Each ![]() = 10 shells
= 10 shells
So, Number of Cockle shells = 10 + 10 + 10 + 10 = 40 shells
Number of Conch Shells = 2 ![]()
Each ![]() = 10 shells
= 10 shells
= 10 + 10 = 20 shells
Number of Lightning Whelk = 2 and a half ![]()
Each ![]() = 10 shells
= 10 shells
= 10 + 10 + 5 = 25 shells
Total number of shells that Maggie collected = 40 + 20 + 25 = 85 shells
Question 4.
How many more cockle shells did she collect than lightning whelks?
______ shells.
Answer: 15
Explanation:
Number of Cockle shells =4 ![]()
Each ![]() = 10 shells
= 10 shells
So, Number of Cockle shells = 10 + 10 + 10 + 10 = 40 shells
Number of Lightning Whelk = 2 and a half ![]()
= 10 + 10 + 5 = 25 shells
Subtract Number of Lightning Whelk shells from Number of Cockle shells
= 40 – 25 = 15 shells
Question 5.
What if the key were “Each ![]() = 5 shells?” How many pictures would there be for conch?
= 5 shells?” How many pictures would there be for conch?
______ pictures
Answer: 4 pictures
Explanation:
Number of Conch Shells = 2 ![]()
If each ![]() = 5 shells
= 5 shells
Then the number of Conch shells will be 4 ![]()
= 5 + 5 + 5 + 5 = 20 shells
Page No. 46000
Common Core
Lessons 2.4–2.6
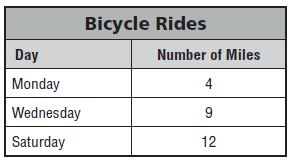
Use the Bicycle Rides frequency table for 1–3.

Question 1.
The frequency table shows the number of miles Sean rode on his bicycle. Use the data in the frequency table to complete the bar graph.
Type below:
_________
Answer:
Question 2.
How many more miles did Sean ride on Saturday than on Monday?
______ miles
Answer: 8 miles
Explanation:
Number of miles that Sean ride on Saturday = 12
Number of miles that Sean ride on Monday = 4
To find how many more miles did Sean ride on Saturday than on Monday
Subtract the number of miles that Sean ride on Monday from Number of miles that Sean ride on Saturday
12 – 4 = 8 miles
Question 3.
Write a number sentence to show how many miles in all Sean rode on his bicycle.
______ miles
Answer: 25 miles
Explanation:
Number of miles that Sean ride on Saturday = 12
Number of miles that Sean ride on Monday = 4
Number of miles that Sean ride on Wednesday = 9
Total number of miles that Sean ride = 12 + 9 + 4 = 25 miles
Lesson 2.7
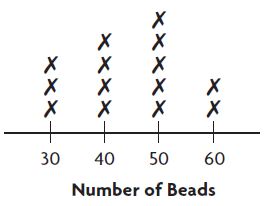
Use the Number of Beads line plot for 4–6.

Question 4.
Kim is making bead necklaces. She records the number of beads on the different necklaces on a line plot. How many necklaces have exactly 50 beads?
______ necklaces
Answer: 5 necklaces
Explanation:
The line plot shows that there are 5 necklaces that have exactly 50 beads.
Question 5.
How many necklaces have fewer than 40 beads?
______ necklaces
Answer: 3 necklaces
Explanation:
The above figure shows that the number of necklaces that have less than 40 beads = 3
Question 6.
How many necklaces have 50 or more beads?
______ necklaces
Answer: 7 necklaces
Explanation:
Number of necklaces that have 50 beads = 5
Number of necklaces that have 60 beads = 2
Total necklaces that have more than 50 beads = 5 + 2 = 7 necklaces.
Conclusion
Represent and Interpret Data chapter includes bar graphs, line plots tally marks, etc. Look at the topics in Chapter 2 before you go ahead with your preparation. To know more such questions Download Go Math Answer Key Grade 3 Chapter 2 Represent and Interpret Data pdf and prepare whenever you want.
